BTCC
/
BTCC Square
/
Thecryptobasic
/
SUI Targets $5 Breakout as Long Positions Hit 60%—Can Bulls Sustain the Momentum?
SUI Targets $5 Breakout as Long Positions Hit 60%—Can Bulls Sustain the Momentum?

17
1
SUI’s price action shows bullish conviction as it eyes a $5 breakout, fueled by a surge in long positions reaching 60% of the market. Traders are betting big on the Layer 1 contender, but can it defy the usual ’buy the rumor, sell the news’ cycle that plagues crypto pumps?
Key levels to watch: A clean hold above $4.50 could confirm upside continuation, while failure here might trigger profit-taking from early entrants. Meanwhile, Bitcoin’s sideways grind leaves altcoins like SUI to carve their own narratives—for better or worse.
Pro tip: Watch for exchange inflows. Nothing derails a breakout like a sudden wave of ’generous’ whales dumping bags on retail.
 SUI Price Chart
According to trend-based Fibonacci levels, the range boundaries align with the 0% and 23.60% levels. With a 1.42% surge in the past four hours, SUI is demonstrating bullish strength at the lower range, increasing the likelihood of a reversal.
The stochastic indicator shows a bullish crossover, and the MACD and signal lines are also approaching a crossover. This would signal a trend reversal and increase the probability of SUI retesting the upper boundary.
If SUI breaks out of the consolidation, the uptrend could target the 50% Fibonacci level at $4.28, followed by the ultimate price target of $5.14. On the downside, key support remains NEAR the psychological level of $3.00.
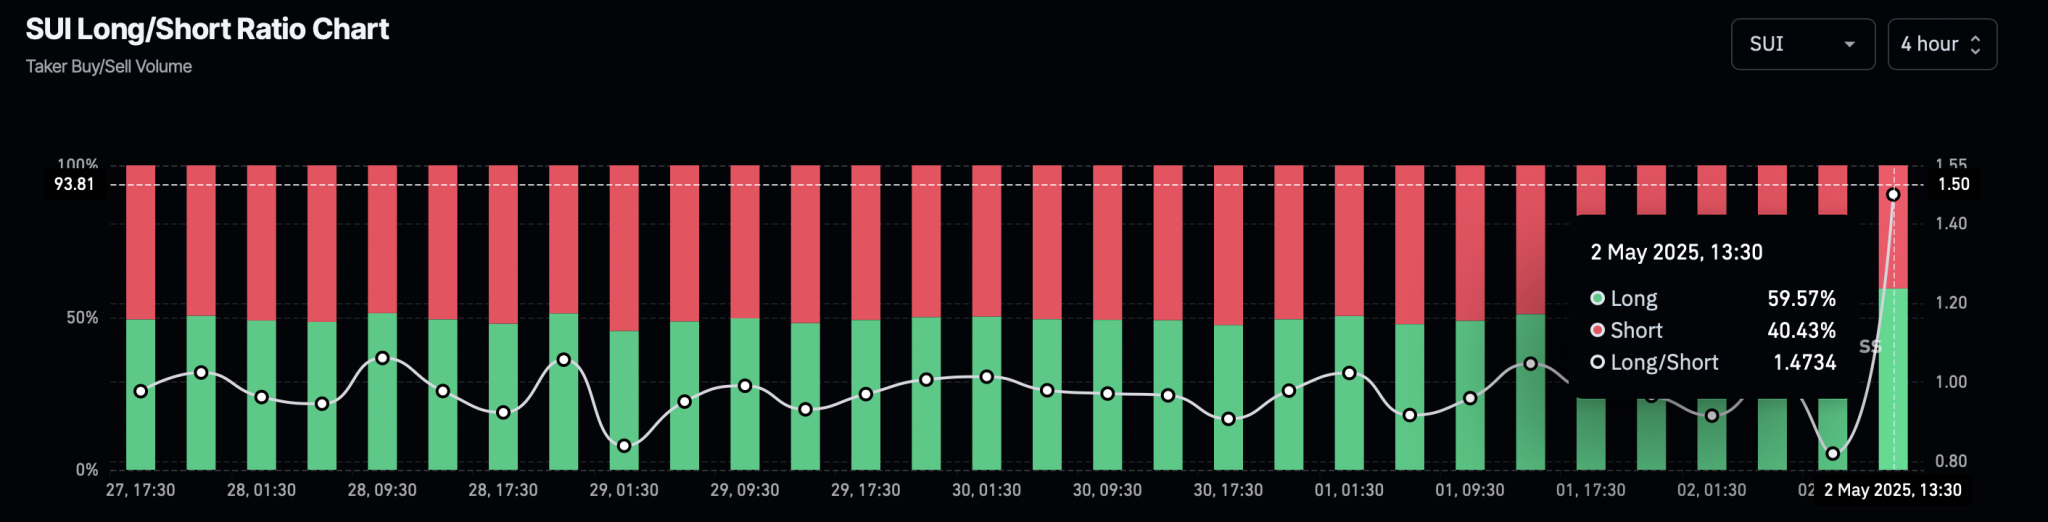
Long Positions in SUI Nears 60%
As SUI holds within its consolidation range, the potential for a bullish breakout has driven an increase in long positions in the derivatives market. According to data from CoinGlass, the SUI long-to-short ratio has risen to 1.4734.
SUI Price Chart
According to trend-based Fibonacci levels, the range boundaries align with the 0% and 23.60% levels. With a 1.42% surge in the past four hours, SUI is demonstrating bullish strength at the lower range, increasing the likelihood of a reversal.
The stochastic indicator shows a bullish crossover, and the MACD and signal lines are also approaching a crossover. This would signal a trend reversal and increase the probability of SUI retesting the upper boundary.
If SUI breaks out of the consolidation, the uptrend could target the 50% Fibonacci level at $4.28, followed by the ultimate price target of $5.14. On the downside, key support remains NEAR the psychological level of $3.00.
Long Positions in SUI Nears 60%
As SUI holds within its consolidation range, the potential for a bullish breakout has driven an increase in long positions in the derivatives market. According to data from CoinGlass, the SUI long-to-short ratio has risen to 1.4734.
By:
Previous
XRP Holders, Listen Up: Why This Volatile Moment Is Your Wake-Up Call
Next
Goldman Doubles Down on Crypto—Institutional Tokenization Push Begins
