Cardano Defies Gravity at $0.67—$0.76 Breakout Incoming?

18
2
ADA bulls dig in as Cardano clings to critical support. The $0.67 level holds—for now—but traders eye the next resistance at $0.76 like Wall Street eyes a bailout.
Technical setup leans bullish: RSI coils near neutral, volume ticks upward. A clean break above $0.76 could trigger algorithmic buying frenzies (and at least three ’I told you so’ tweets from crypto influencers).
Watch for fakeouts—this market loves nothing more than liquidating overeager leverage traders. After all, what’s finance without a little ritual sacrifice?
 Cardano Price Chart
According to Fibonacci retracement levels on the 4-hour chart, the pattern’s neckline aligned with the 61.80% retracement level near $0.67.
The breakout rally faced resistance near the 78.60% Fibonacci level at $0.7156, leading to an intraday pullback to retest the 61.80% level.
However, the recent surge in bullish sentiments has led to a positive crossover in the 50 and 100 EMA lines.
Meanwhile, the MACD and signal lines warn of a negative crossover due to a sudden pause in bullish momentum.
If a post-retest recovery occurs, the price will likely target the $0.76 resistance, followed by the 1.27 Fibonacci extension level at $0.83. On the downside, key support lies at the 200 EMA line at $0.65, followed by the $0.61 support zone.
Derivatives market Signals Strong Upside for ADA
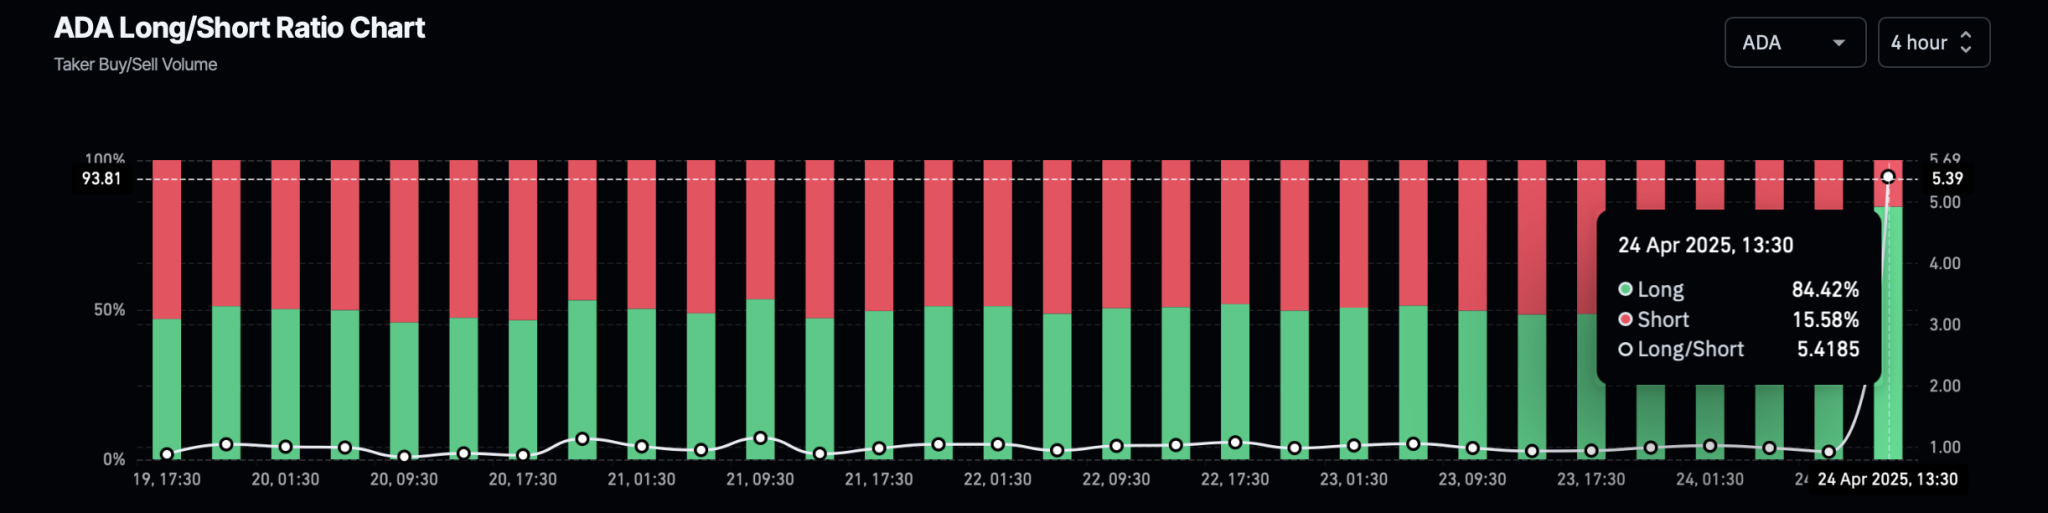
Despite this short-term pullback, Cardano’s broader market anticipation remains highly bullish. In the derivatives market, the long positions account for nearly 84.42% over the past four hours.
This records an impressive long-to-short ratio of 5.41, signaling strong bullish sentiments for Cardano.
Cardano Price Chart
According to Fibonacci retracement levels on the 4-hour chart, the pattern’s neckline aligned with the 61.80% retracement level near $0.67.
The breakout rally faced resistance near the 78.60% Fibonacci level at $0.7156, leading to an intraday pullback to retest the 61.80% level.
However, the recent surge in bullish sentiments has led to a positive crossover in the 50 and 100 EMA lines.
Meanwhile, the MACD and signal lines warn of a negative crossover due to a sudden pause in bullish momentum.
If a post-retest recovery occurs, the price will likely target the $0.76 resistance, followed by the 1.27 Fibonacci extension level at $0.83. On the downside, key support lies at the 200 EMA line at $0.65, followed by the $0.61 support zone.
Derivatives market Signals Strong Upside for ADA
Despite this short-term pullback, Cardano’s broader market anticipation remains highly bullish. In the derivatives market, the long positions account for nearly 84.42% over the past four hours.
This records an impressive long-to-short ratio of 5.41, signaling strong bullish sentiments for Cardano.
By:
