BTCC
/
BTCC Square
/
Thecryptobasic
/
PEPE’s Double Bottom Breakout: Meme Coin Eyes $0.000010 as Traders Pile In
PEPE’s Double Bottom Breakout: Meme Coin Eyes $0.000010 as Traders Pile In

5
3
Frogs are jumping again—PEPE just printed a textbook double bottom pattern, and crypto degens are betting the farm on a 2x pump.
Chartists point to the 8-hour candle close above $0.0000078 as confirmation. Liquidity pools above $0.000009 look like low-hanging fruit for a meme coin that’s already ripped 400% this year.
Of course, this could just be another ’technical analysis’ hallucination—right up until some hedge fund intern dumps their bags on retail. Either way, grab your popcorn.
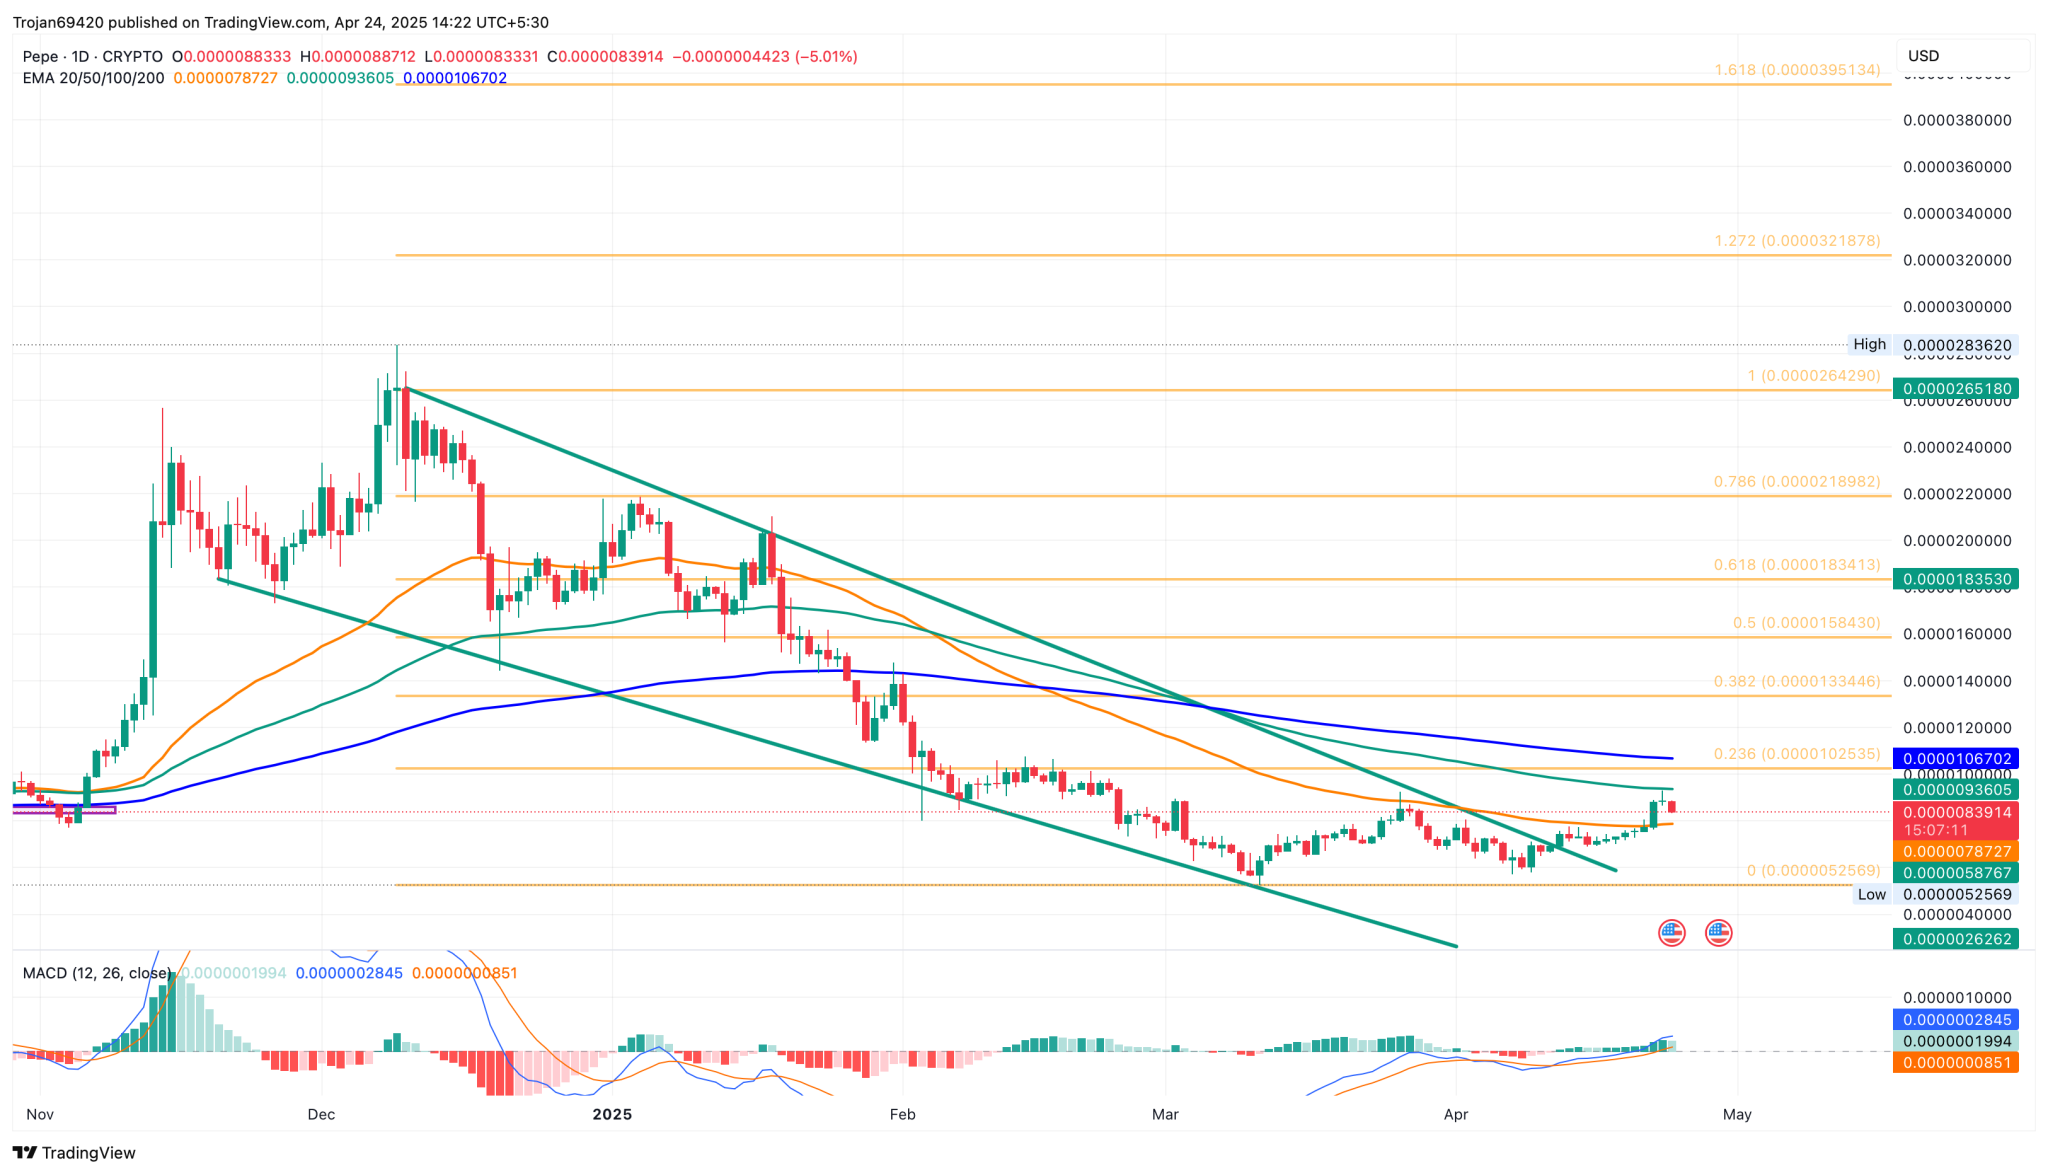 Pepe Price ChartPepe Price Chart
With a post-retest turnaround, Pepe’s recovery run surpassed the 50-day EMA line at $0.000007872. On April 22, PEPE posted a nearly 14% surge, forming a bullish engulfing candle.
However, the uptrend failed to surpass the 100-day EMA line at $0.000009360. Taking a bearish turnaround from the dynamic resistance, Pepe witnessed a minor intraday pullback.
Currently, it is trading at $0.0000083 with a pullback of nearly 5%. This creates an evening star pattern from the dynamic resistance, teasing a sharper correction move.
Additionally, this bearish reversal reflects a failed attempt to maintain a position above the $0.000008832 resistance level, considered the neckline of a double bottom pattern.
If PEPE fails to sustain above this neckline, the bullish pattern may be invalidated. However, the MACD and Signal lines still show a positive trend, supporting the potential for continued upward momentum.
The appearance of bullish histogram bars further supports the likelihood of an extended rally.
Whale Adds More PEPE Amid Bullish Momentum
Amid the recent price surge, a wallet possibly belonging to Bitpanda has started a new buying spree over the past 48 hours. Recently, the wallet accumulated 208 billion PEPE tokens worth $1.64 million, bringing its total holdings to 553 billion PEPE, valued at nearly $5 million.
Pepe Price Targets
According to Fibonacci retracement levels, a successful breakout above the double bottom neckline could lead PEPE to test the 23.60% Fibonacci level at $0.00001025. If momentum continues, the next key target would be the 50% Fibonacci level at $0.00001584.
On the downside, key support remains at the 50-day EMA around $0.000007873, followed by horizontal support at $0.0000052.
Pepe Price ChartPepe Price Chart
With a post-retest turnaround, Pepe’s recovery run surpassed the 50-day EMA line at $0.000007872. On April 22, PEPE posted a nearly 14% surge, forming a bullish engulfing candle.
However, the uptrend failed to surpass the 100-day EMA line at $0.000009360. Taking a bearish turnaround from the dynamic resistance, Pepe witnessed a minor intraday pullback.
Currently, it is trading at $0.0000083 with a pullback of nearly 5%. This creates an evening star pattern from the dynamic resistance, teasing a sharper correction move.
Additionally, this bearish reversal reflects a failed attempt to maintain a position above the $0.000008832 resistance level, considered the neckline of a double bottom pattern.
If PEPE fails to sustain above this neckline, the bullish pattern may be invalidated. However, the MACD and Signal lines still show a positive trend, supporting the potential for continued upward momentum.
The appearance of bullish histogram bars further supports the likelihood of an extended rally.
Whale Adds More PEPE Amid Bullish Momentum
Amid the recent price surge, a wallet possibly belonging to Bitpanda has started a new buying spree over the past 48 hours. Recently, the wallet accumulated 208 billion PEPE tokens worth $1.64 million, bringing its total holdings to 553 billion PEPE, valued at nearly $5 million.
Pepe Price Targets
According to Fibonacci retracement levels, a successful breakout above the double bottom neckline could lead PEPE to test the 23.60% Fibonacci level at $0.00001025. If momentum continues, the next key target would be the 50% Fibonacci level at $0.00001584.
On the downside, key support remains at the 50-day EMA around $0.000007873, followed by horizontal support at $0.0000052.
By:
Previous
Twenty One Capital CEO Bets Big on Bitcoin: ’We’re Building Fortunes, Not Portfolios’
Next
Crypto Guru to Gen Z: Ditch the 9-to-5, Stack Sats Instead
