Cardano’s Golden Cross Sparks Rally: $1 Target in Sight as Bulls Take Control

Cardano's charts just flashed the crypto equivalent of a green light—and traders are slamming the gas. The ADA golden cross (that hallowed 50-day/200-day MA crossover) has historically signaled the start of parabolic runs. Now, the $1 psychological barrier is back in play.
Why This Matters
Golden crosses don't guarantee moonshots, but they've preceded every major Cardano rally since 2021. With Bitcoin dominance wavering, altcoins like ADA are primed to absorb capital from impatient BTC maxis.
The Cynical Take
Of course, Wall Street's 'technical analysis' crowd will claim they saw this coming—right after they finish explaining why last week's 'death cross' was totally irrelevant. Meanwhile, retail traders brace for the classic 'buy high, panic low' cycle.

Cardano’s (ADA) impressive recovery from the $0.53 support earlier this month has helped the altcoin gain more than 50% in July alone.
As a result, ADA surged past key moving averages and even formed a bullish golden cross pattern on its daily chart, a classic signal of a long-term uptrend.
This technical breakout comes amid renewed Optimism for Cardano’s ecosystem, which now hosts over 2,000 projects and is preparing for a major Hydra upgrade to improve its speed.
Forward-looking traders are eagerly watching to see whether this momentum can carry ADA toward the much-awaited $1 mark.
Can Cardano Break Above $1 After a Golden Cross on Charts?
Cardano finally snapped a two-month downtrend after breaking out of its descending channel earlier this month.
The resulting rally carried the ADA price straight above its 20, 50, and 200-day EMAs, reaching a four-month high near $0.94 on July 21.
Interestingly, this uptrend has helped ADA see a convincing golden cross on its daily chart. A golden cross typically occurs when the 20 or 50-day averages MOVE above the 200-day line, confirming a relatively long-term bullish trend shift.

Looking ahead, the first major resistance now lies around the $0.9 level. Clearing this barrier can directly clear ADA’s path above the highly anticipated $1 level, especially if the golden cross trajectory holds up.
On the other hand, a decisive break below the $0.8 horizontal support or the 20-day EMA WOULD invalidate the bullish structure and expose ADA to the May lows near $0.7.
ADA Bulls Take a Breather as RSI Resets, Setting Stage for Next Rally
The 14-day RSI cooled from an overbought spike above 80 to 63 at the time of writing. While this reading tells us that ADA bulls have a strong edge, the oscillator is still far from its overbought region.
In previous cycles, comparable pullbacks in RSI after an initial overbought rally have acted as a reset before a second leg higher.
If that scenario plays out, ADA would likely consolidate around $0.8, potentially even testing the 20-day EMA before buyers step in.
Meanwhile, the MACD (blue) and signal (orange) lines remain in positive territory, but their gap has begun to narrow while the indicator’s histogram bars shrink.
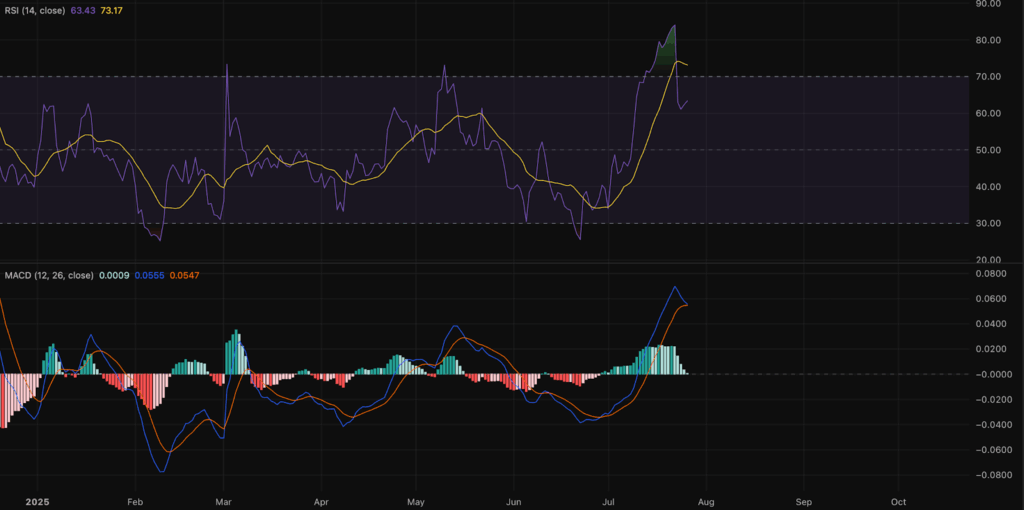
MACD’s trajectory tells us upside momentum is slowing, which is typical after a volatile breakout. A potential bearish cross of the MACD and signal line within the next few sessions would hint at a near-term slowdown, rather than a full-blown trend reversal.
Looking at the big picture, ADA’s price could be on the cusp of a new uptrend. However, a brief consolidation phase appears healthy before a decisive close above the $1 mark.
Top Traders Go Long ADA Despite Declining Futures Volume
Coinglass data showed that futures volume decreased by 57% over the past day to $1.54 billion, while open interest ROSE by 4.2% to $1.48 billion.
In other words, traders are not opening many new positions, yet those already in the game are letting their leverage ride.
This behavior is generally constructive, as long as the price doesn’t suddenly slip, because it keeps liquidity pools intact for the next breakout move.
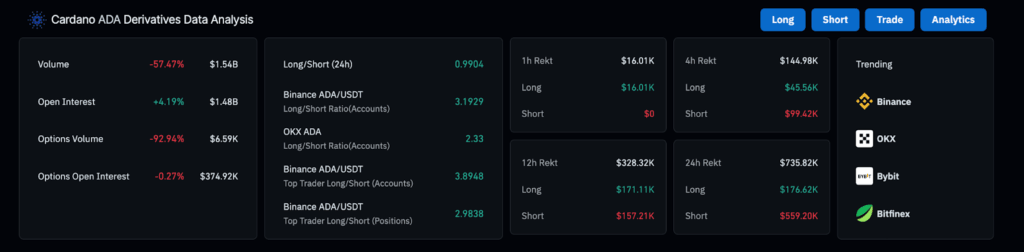
The overall 24-hour long/short ratio is neutral at 0.99, but traders on Binance and OKX are heavily favoring longs, with ratios of 3.19 and 2.33.
It’s worth noting that top traders on Binance are even more aggressive, running nearly 3.8 longs for every short on an account basis and three longs per short by position size.
This trend indicates that smart money continues to view pullbacks as entry opportunities rather than exit signals.

Log in to Reply
Log in to comment your thoughtsComments
Related Articles
|Square
Get the BTCC app to start your crypto journey
Get started today Scan to join our 100M+ users