Ethereum News: Selling Pressure Surges 300% as Long-Term Holders Dump ETH

- The Perfect Bearish Storm for Ethereum
- Hodlers Exit: 300% Spike in ETH Sell-Offs
- Death Cross Looms Over ETH Charts
- Critical Support Levels to Watch
- Any Hope for Bulls?
- Ethereum Market Dynamics: Your Questions Answered
Ethereum faces a perfect storm of bearish signals as long-term holders offload holdings at unprecedented rates while a death cross looms. Our analysis reveals why ETH's price could drop another 13%—or more.
The Perfect Bearish Storm for Ethereum
Ethereum's price rebound faces existential threats from two converging bearish indicators. First, blockchain data shows long-term holders (hodlers) suddenly dumping ETH at rates not seen in recent history. Second, the technical chart prepares to flash its most feared pattern—the death cross. When these signals align, history suggests rallies fail and prices test lower supports.
Hodlers Exit: 300% Spike in ETH Sell-Offs
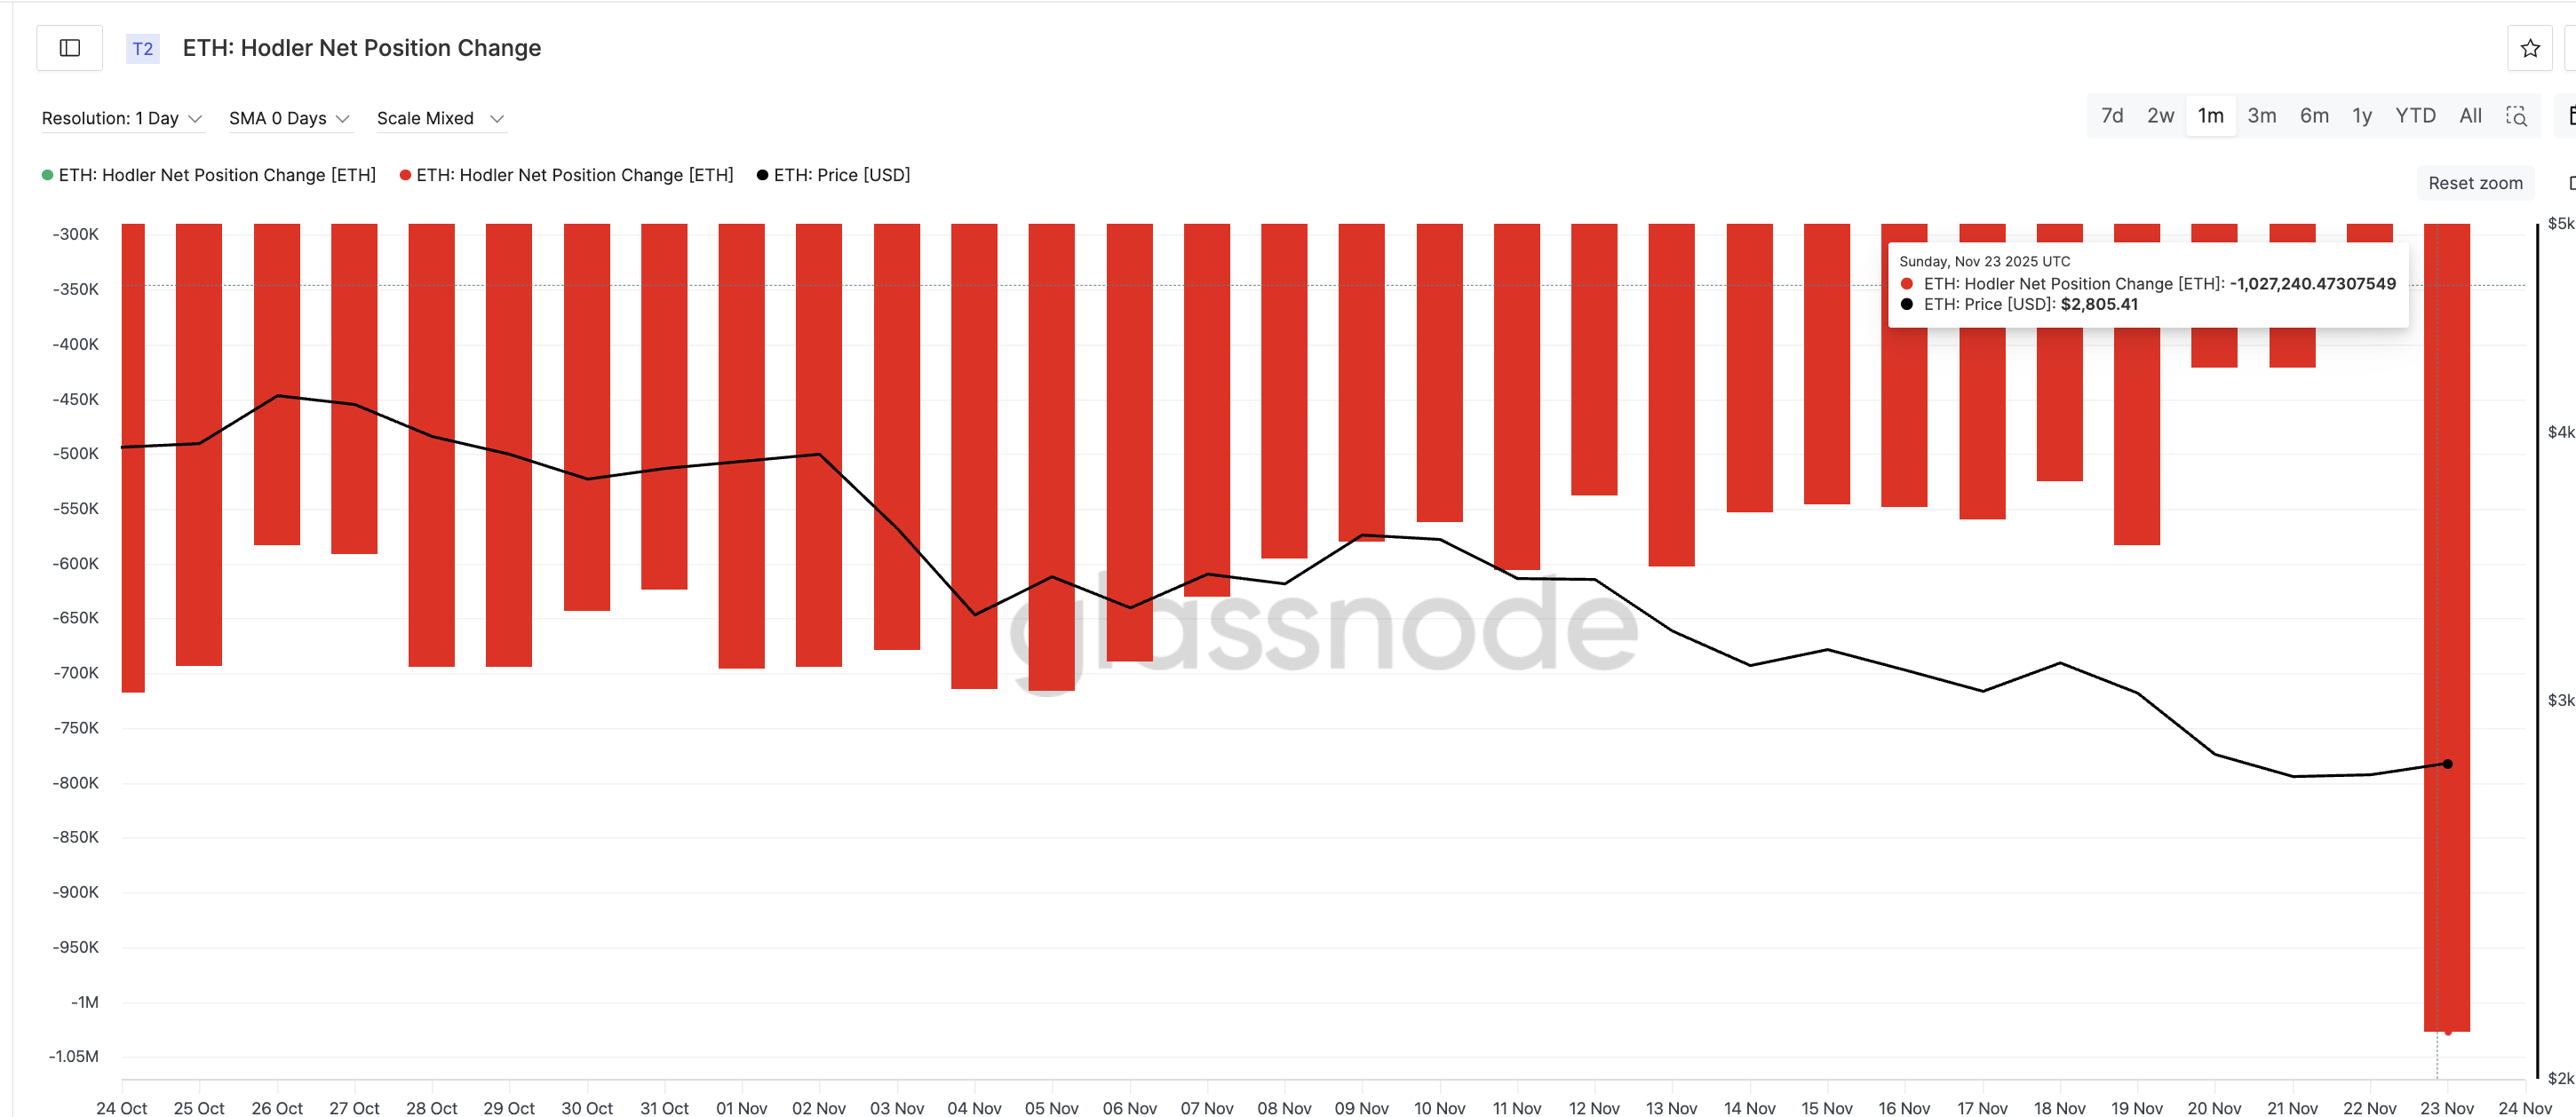
On-chain metrics reveal alarming behavior change among Ethereum's most steadfast supporters. Hodlers—wallets holding ETH for 155+ days—typically represent the market's "diamond hands." But between November 22-23, their net selling exploded from 334,600 ETH to 1,027,240 ETH. That's a 300% single-day surge in sell pressure from the cohort that usually provides price stability.
"When long-term believers become sellers, it fundamentally changes market psychology," notes the BTCC research team. "Their actions suggest deteriorating confidence in ETH's medium-term prospects."
Death Cross Looms Over ETH Charts
As if the hodler exodus wasn't concerning enough, Ethereum's technical setup grows increasingly ominous. The 50-day EMA (exponential moving average) threatens to cross below the 200-day EMA—the dreaded "death cross" that often precedes extended downtrends.
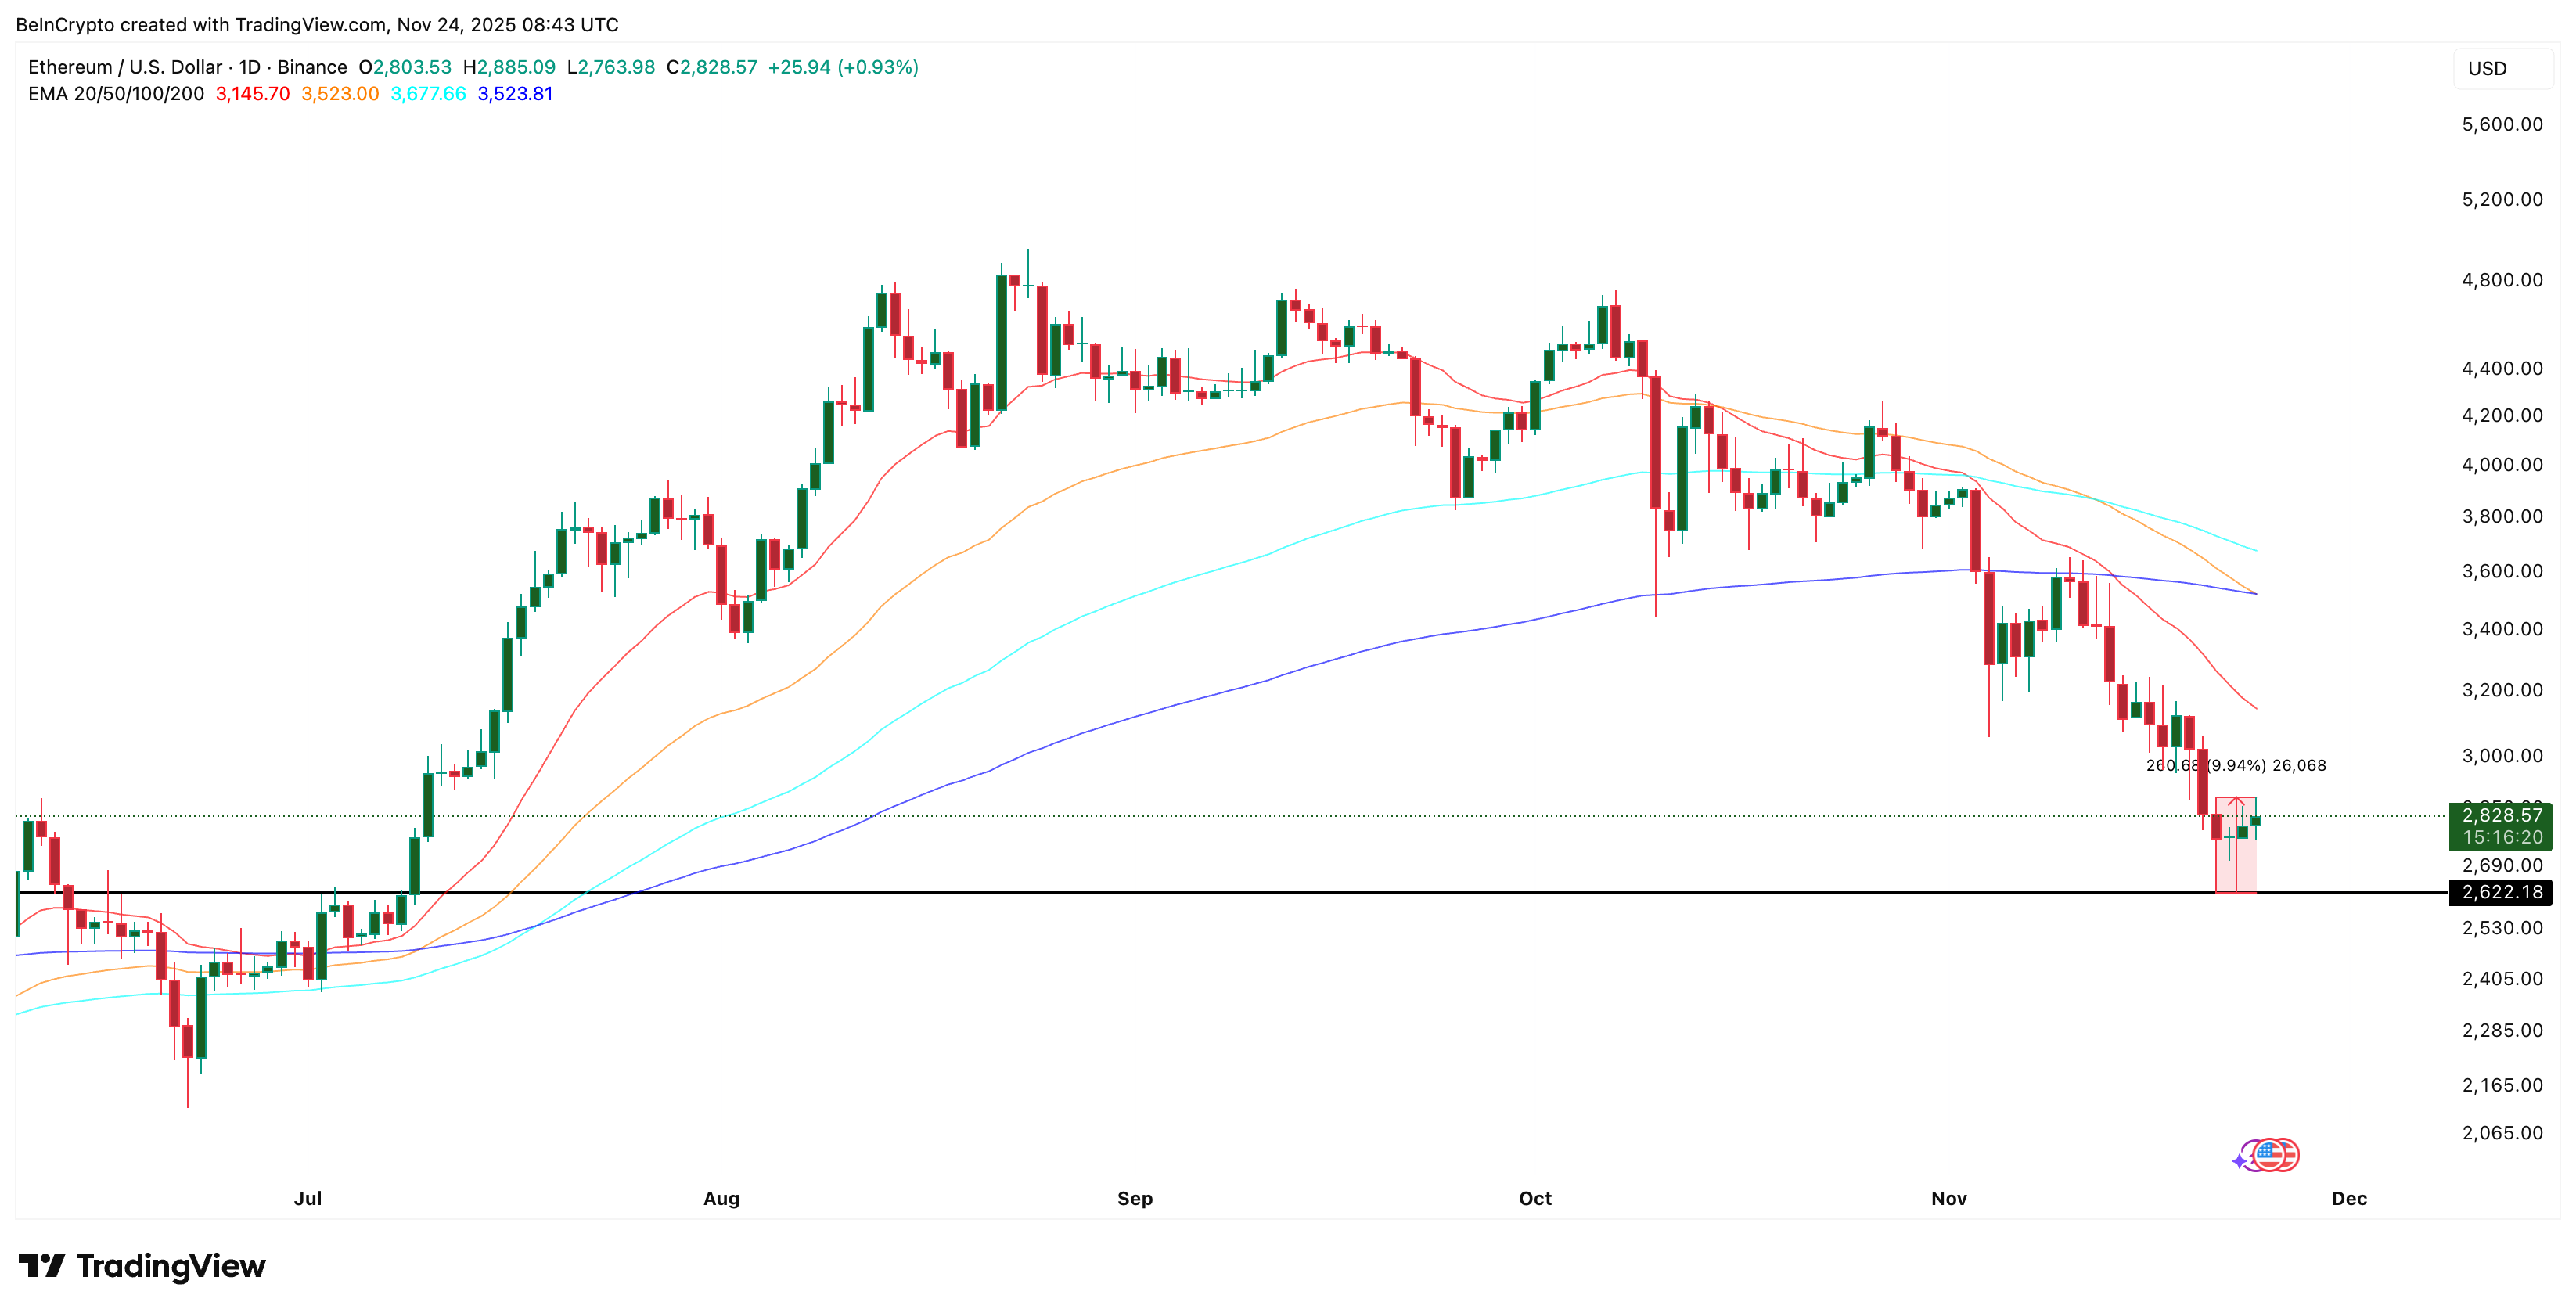
EMA crosses matter because they reflect shifting momentum. The 50-day crossing under the 200-day suggests weakening near-term sentiment that could accelerate declines. With ETH already in a broader downtrend, this technical development might open floodgates for more selling.
Critical Support Levels to Watch
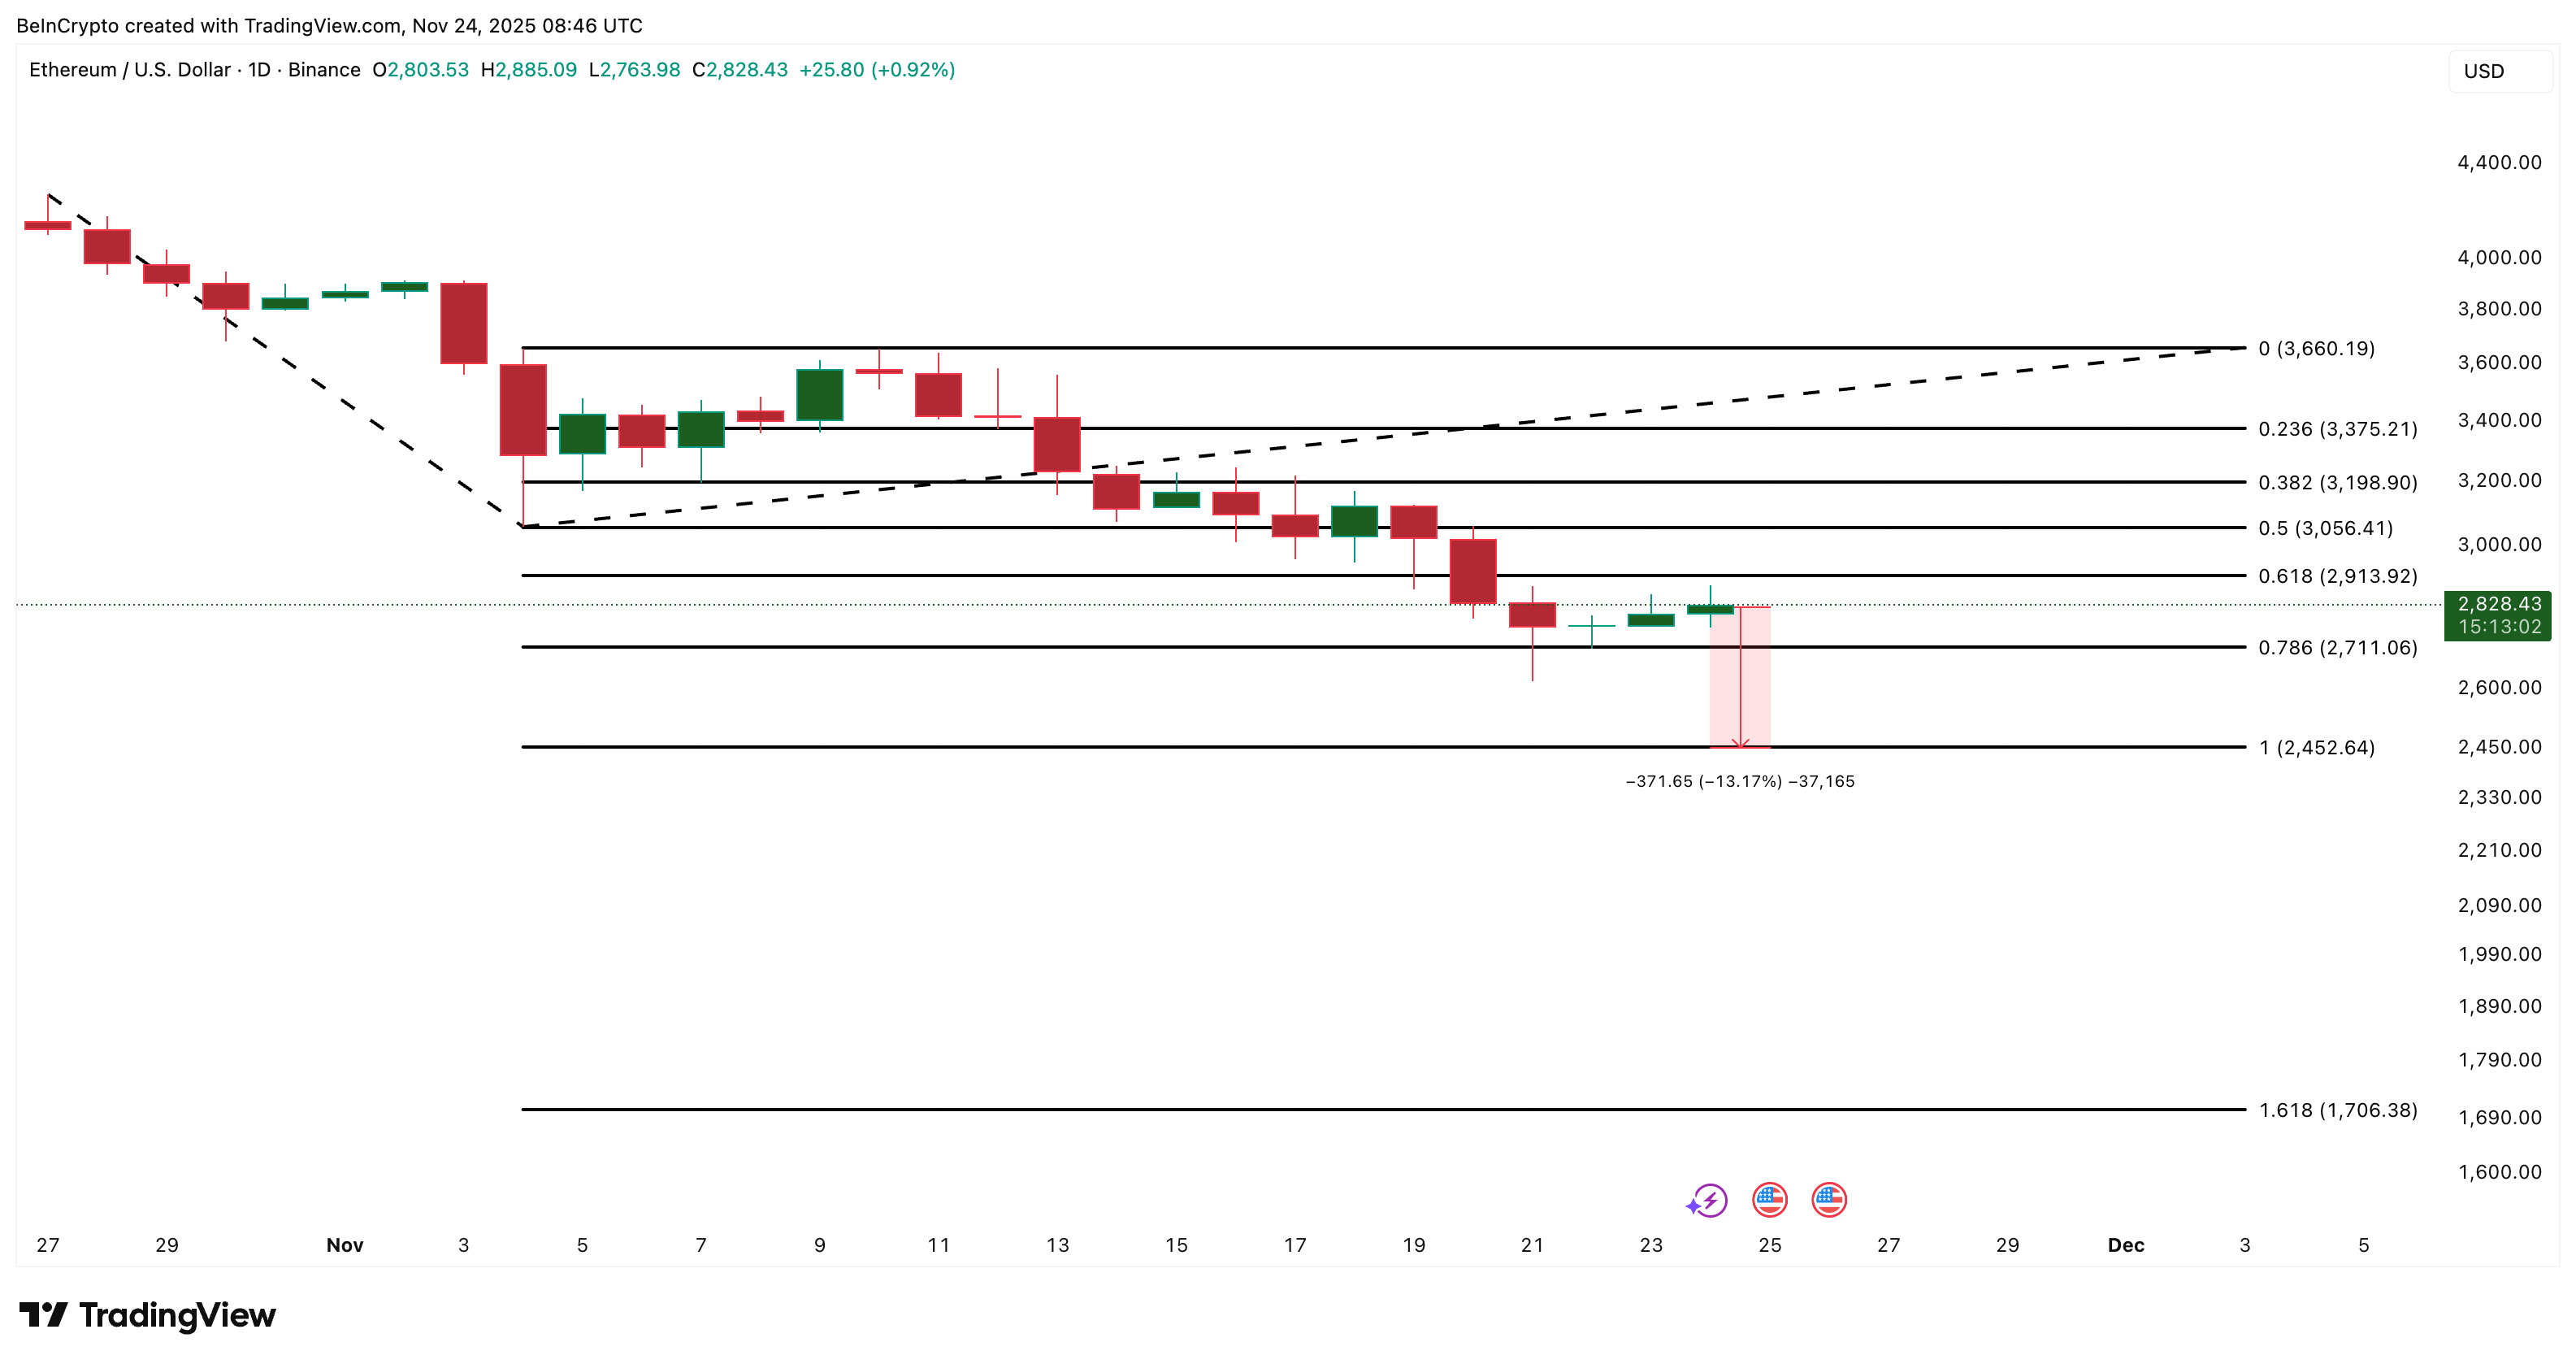
At current prices near $2,820, ethereum faces more resistance overhead than support below. The first line in the sand sits at $2,710 (the 0.786 Fibonacci level). If that breaks, $2,450 becomes the next likely target—a 13% drop from current levels.
The $1,700 zone represents the nightmare scenario—a level that only comes into play if:
- The death cross fully forms
- Hodler selling persists
- Market conditions deteriorate further
Any Hope for Bulls?
Recovery isn't impossible—just improbable under current conditions. ETH WOULD need to:
- Recapture $3,190 (first major resistance)
- Break through $3,660 (trend-change confirmation)
But with both fundamental (hodler selling) and technical (death cross) factors aligned against it, Ethereum faces its most challenging environment since the 2022 bear market. As one trader quipped on Crypto Twitter: "When the HODLers fold, even the bravest bulls get cold feet."
This article does not constitute investment advice.
Ethereum Market Dynamics: Your Questions Answered
Why are long-term Ethereum holders selling now?
Several factors could explain the sudden hodler exodus: profit-taking after the recent rebound, loss of confidence in ETH's short-term prospects, or portfolio rebalancing ahead of potential macroeconomic shifts. The timing suggests many believe better entry points lie ahead.
How reliable is the death cross indicator?
While not infallible, death crosses have preceded major ETH downturns in 2018, 2020, and 2022. The pattern gains credibility when accompanied by fundamental weakness—exactly what we're seeing with the hodler sell-off.
Could Ethereum defy these bearish signals?
Markets occasionally shrug off technical patterns during strong fundamental environments. However, with the Fed maintaining restrictive policies and crypto markets generally risk-off, ETH faces headwinds beyond just chart patterns.
