Bitcoin Plunges Below $113,000 - But This Bullish Signal Screams Buy Opportunity

Bitcoin's brutal correction just hit a nerve—crashing through the $113,000 support level that had traders holding their breath.
The Indicator That Defies Panic
While weak hands flee, a key technical metric flashes green. The same signal that preceded every major Bitcoin rally since 2020 just triggered—suggesting this dip represents institutional accumulation, not genuine weakness.
Market Psychology at Breaking Point
Fear dominates headlines as leveraged positions get liquidated. Yet historical data shows these shakeouts consistently separate speculators from long-term believers. Traditional finance pundits—busy predicting crypto's demise—somehow ignore the $9 billion in institutional inflows this quarter alone.
Timing the Bottom
Volatility spikes when sentiment extremes meet technical triggers. This indicator suggests we're witnessing classic capitulation—the final purge before the next leg up. Because nothing makes Wall Street analysts more uncomfortable than Bitcoin outperforming their precious gold ETFs yet again.
TD Sequential Has Just Given A Buy Signal For Bitcoin
In a new post on X, analyst Ali Martinez has talked about how the Tom Demark (TD) Sequential has just formed a signal for Bitcoin on its 4-hour price chart. The TD Sequential is an indicator from technical analysis (TA) that’s used for locating potential points of reversal in an asset’s price.
The indicator involves two phases. In the first of these, known as the setup, it counts candles of the same color up to nine. Once the ninth candle is in, it gives a turnaround signal for the asset. Naturally, the signal is a buy one if the preceding candles were red and a sell one if they were green.
As soon as the setup is over, the second phase, called the countdown, kicks off. The countdown works much like the setup, with the key difference being that the indicator counts up thirteen candles here, not nine. Following these thirteen candles, the price trend is considered to have reached exhaustion once more. In other words, the asset may have reached another top or bottom.
Bitcoin has completed a TD Sequential phase of the first type recently. Below is the chart shared by Martinez that shows the signal forming in BTC’s 4-hour price.
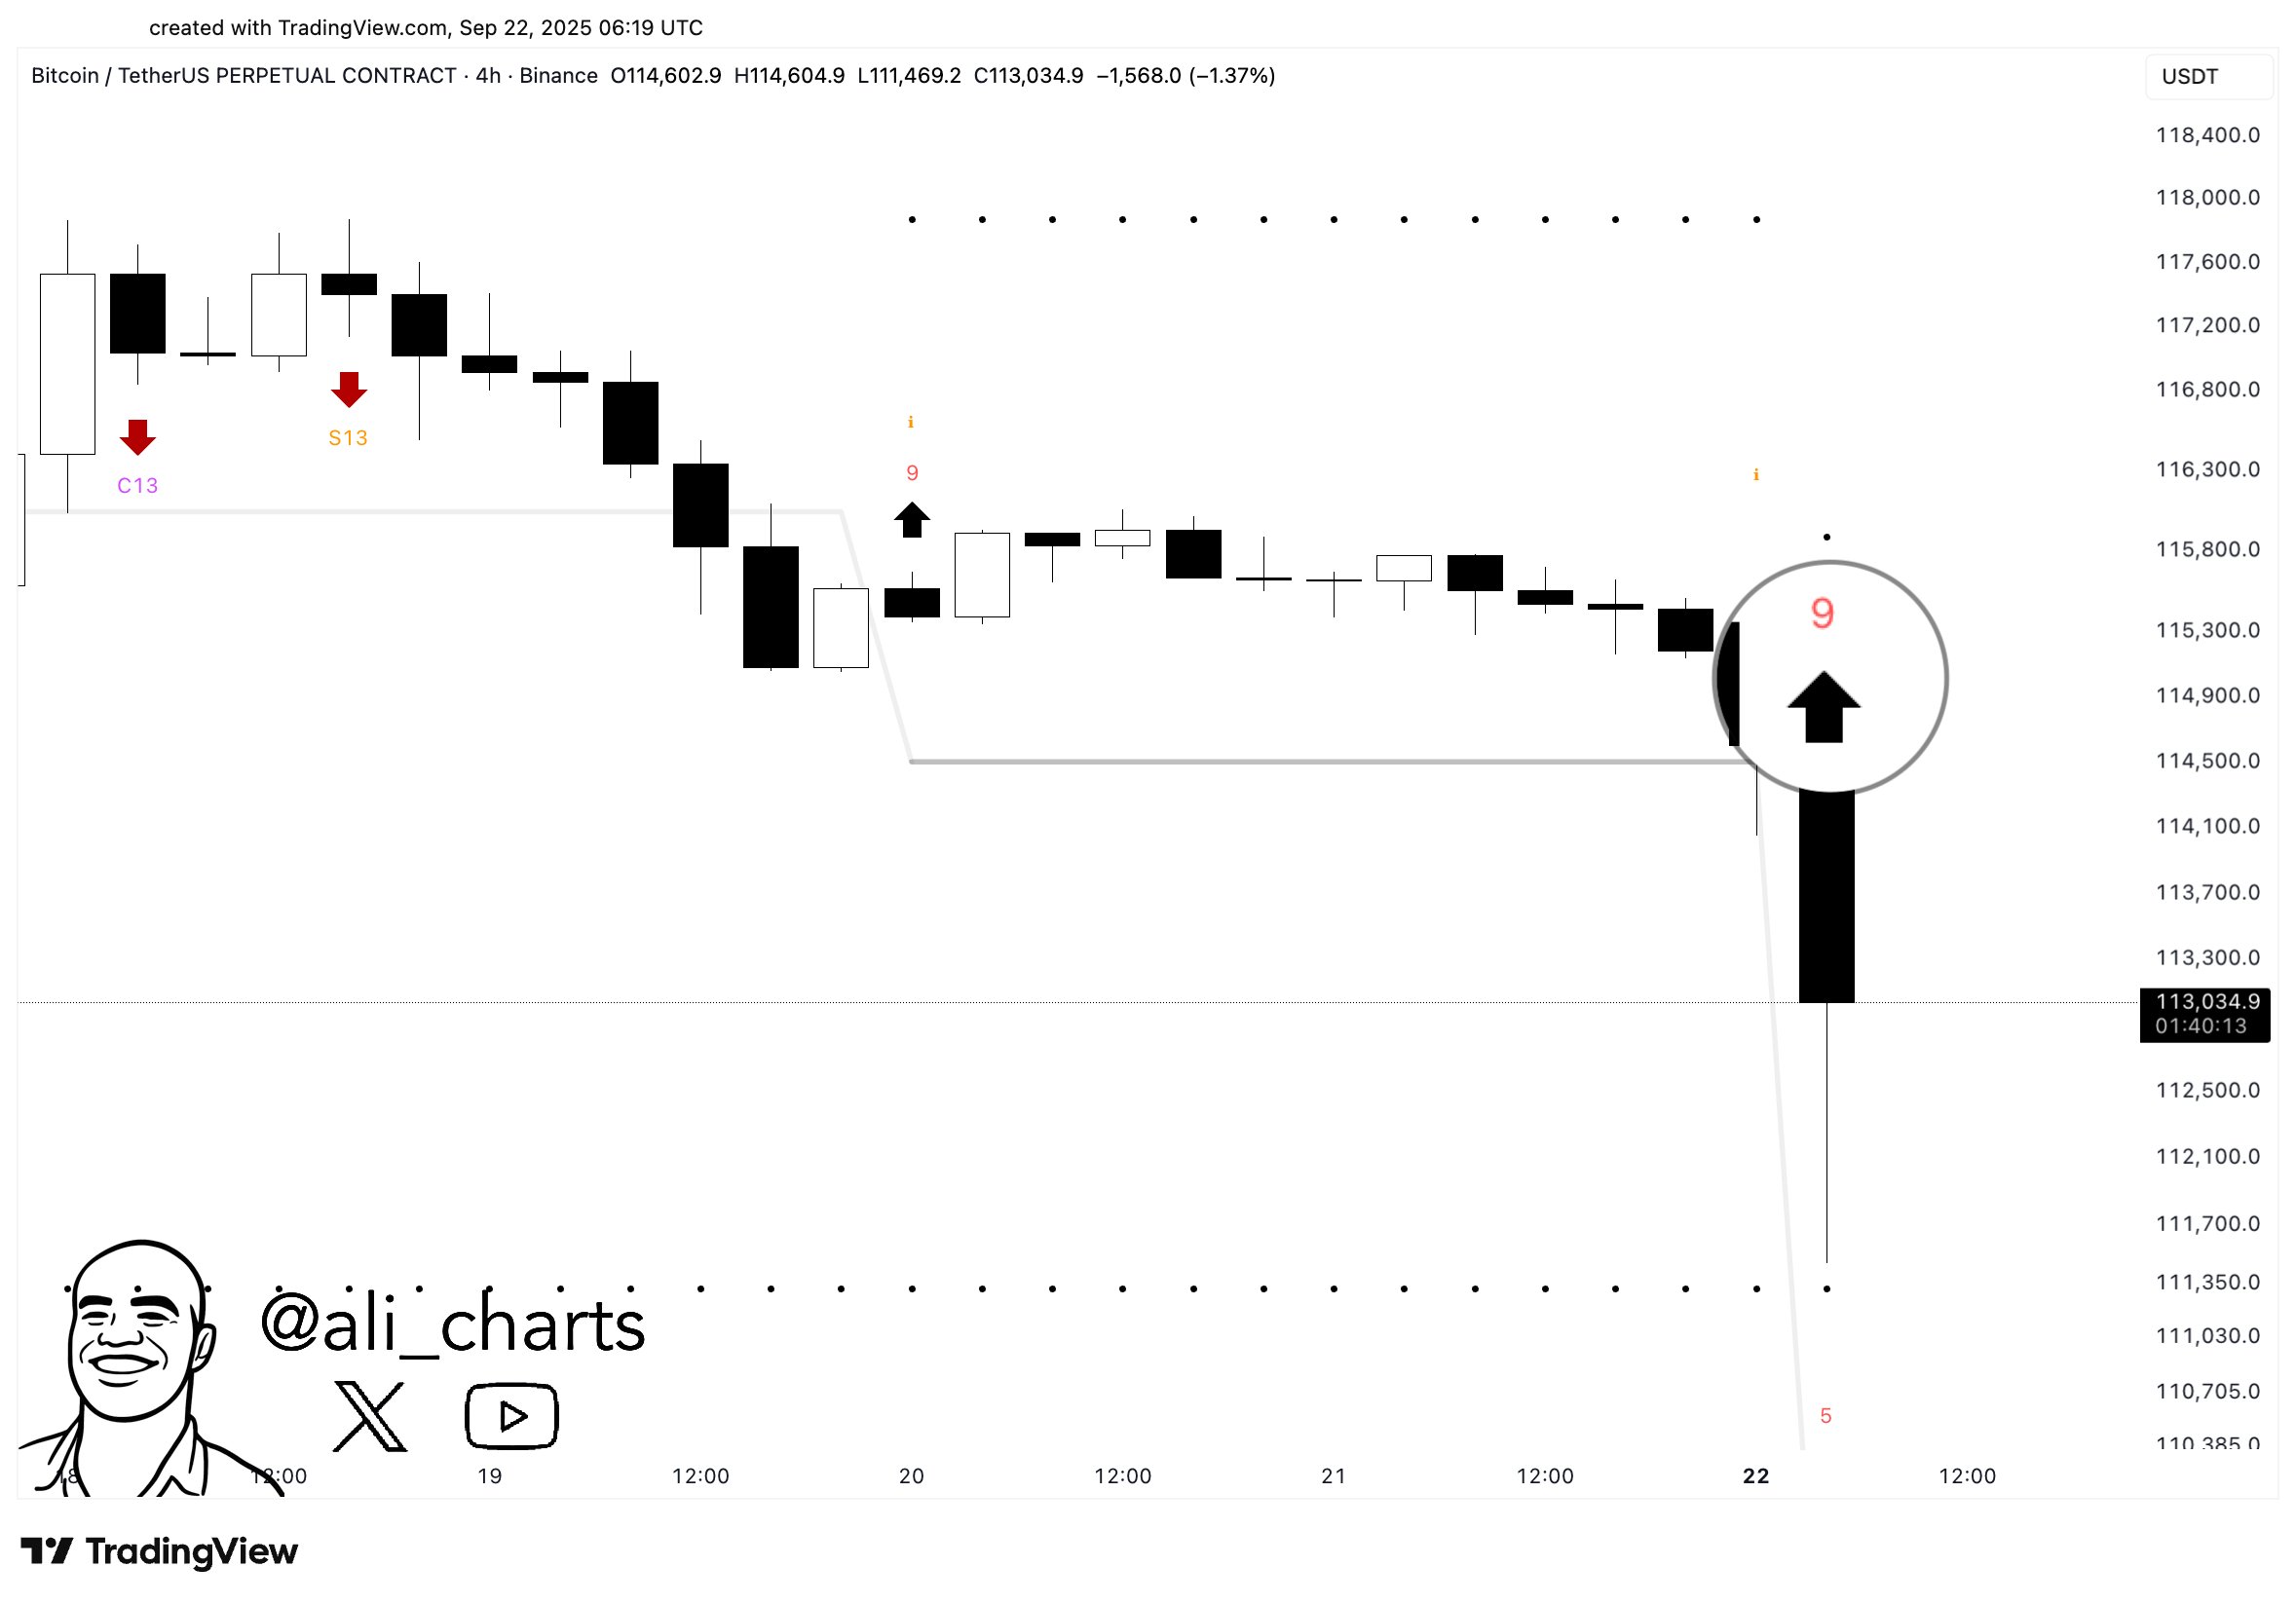
From the graph, it’s visible that the TD Sequential has completed this setup with nine red candles, which implies bitcoin may have arrived at some sort of bottom.
The signal has come as the cryptocurrency’s price has plummeted and retraced its recent recovery. It now remains to be seen whether the buy setup will hold, or if there is more decline coming for the asset.
In another X post, the analyst has talked about a potential pattern forming for Bitcoin that could also point to a bullish outcome.

As displayed in the above chart, Bitcoin’s 4-hour price has potentially been following an inverse head-and-shoulders. This pattern appears whenever an asset’s price registers a low (called the head) between two higher lows (the shoulders).
BTC has formed the left shoulder and head so far, with the right shoulder possibly brewing with the price crash. In the scenario that the right shoulder does get confirmed, a bullish breakout may follow for the cryptocurrency, since an inverse head-and-shoulders is generally considered to be a bullish reversal pattern.
BTC Price
At the time of writing, Bitcoin is trading around $112,300, down over 2.5% in the last 24 hours.
