Solana (SOL) Surges Higher – Bulls Eye Next Major Resistance as Trading Volume Accelerates

Solana rockets upward as bullish momentum builds—traders are targeting the next critical resistance level while volume spikes signal serious conviction.
Volume Tells the Real Story
You don't get moves like this without big money flowing in. Trading activity is surging, suggesting this isn't just retail FOMO—institutions might finally be waking up to what Solana's actually built to do.
Breaking Through the Noise
While other chains talk about scalability, Solana's just doing it. No fancy roadmaps, no vague promises—just raw throughput and lower fees while Ethereum maxis still argue about gas optimizations. The network's proving its resilience after last year's setbacks, and the market's taking notice.
Where This Could Go
If volume sustains and bulls hold control, we could see a run toward levels not touched since the last cycle's peak. Of course, traditional finance pundits will call it irrational—right before quietly allocating their own funds into the space they publicly ridicule.
Solana Price Corrects Some Gains
Solana price started a decent increase after it settled above the $232 zone, beating Bitcoin and Ethereum. SOL climbed above the $240 level to enter a short-term positive zone.
There was a break above a key bearish trend line with resistance at $240 on the hourly chart of the SOL/USD pair. The price even smashed the $245 resistance. The bulls were able to push the price above the $250 barrier. A high was formed NEAR $253 and the price recently corrected some gains.
There was a MOVE below the 23.6% Fib retracement level of the upward wave from the $232 swing low to the $253 high. However, the bulls were active above $242.
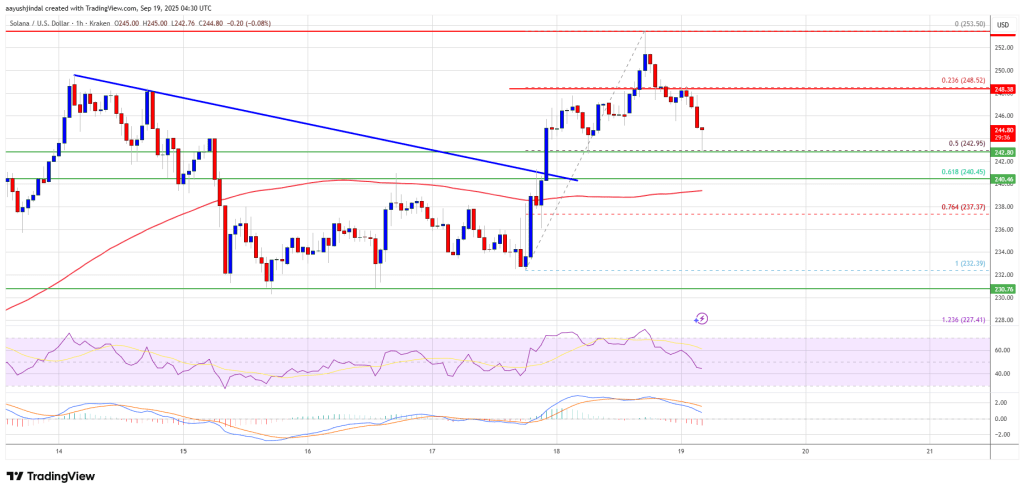
Solana is now trading above $242 and the 100-hourly simple moving average. On the upside, the price is facing resistance near the $248 level. The next major resistance is near the $254 level. The main resistance could be $255. A successful close above the $255 resistance zone could set the pace for another steady increase. The next key resistance is $268. Any more gains might send the price toward the $272 level.
More Losses In SOL?
If SOL fails to rise above the $248 resistance, it could start another decline. Initial support on the downside is near the $242 zone and the 50% Fib retracement level of the upward wave from the $232 swing low to the $253 high. The first major support is near the $240 level.
A break below the $240 level might send the price toward the $232 support zone. If there is a close below the $232 support, the price could decline toward the $220 support in the near term.
Technical Indicators
Hourly MACD – The MACD for SOL/USD is losing pace in the bullish zone.
Hourly Hours RSI (Relative Strength Index) – The RSI for SOL/USD is below the 50 level.
Major Support Levels – $242 and $240.
Major Resistance Levels – $248 and $255.
