BNB Price Surge Approaches $1,000 Milestone – Are Bulls Primed for the Next Breakthrough?

BNB rockets toward the psychological $1,000 barrier—fueling speculation of another explosive leg up.
Momentum Builds
Traders pile into the token as it flirts with four-digit territory, defying broader market hesitation. The rally showcases BNB's unique ecosystem advantages while traditional finance still debates whether crypto is 'a phase.'
Key Resistance Ahead
Breaking $1,000 isn't just a number—it's a signal. Past this level, the path clears toward previous all-time highs, though profit-taking could trigger short-term pullbacks. Meanwhile, Wall Street analysts remain busy downgrading stocks that actually make money.
Bullish catalysts align: burning mechanisms, platform utility, and growing adoption contrast sharply with legacy systems bogged down by paperwork and permissioned slowness. This isn't just price action—it's a market voting with its wallet.
Will BNB shatter the ceiling? The charts suggest yes, but in crypto, the only certainty is volatility.
BNB Price Hits New ATH
BNB price formed a base above the $900 level and started a fresh increase, beating ethereum and Bitcoin. There was a steady move above the $940 and $950 levels.
The bulls even cleared the $980 resistance zone. A new all-time high was formed at $995 and the price is now consolidating gains. There was a minor decline and the price tested the 23.6% Fib retracement level of the upward MOVE from the $948 swing low to the $995 high.
The price is now trading above $980 and the 100-hourly simple moving average. Besides, there is a key bullish trend line forming with support at $960 on the hourly chart of the BNB/USD pair.
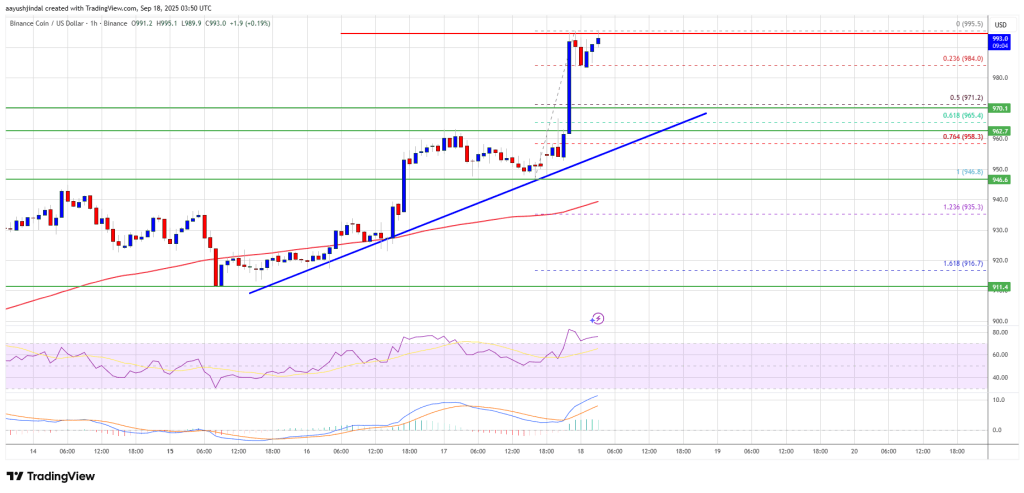
On the upside, the price could face resistance near the $995 level. The next resistance sits near the $1,000 level. A clear move above the $1,000 zone could send the price higher. In the stated case, BNB price could test $1,050. A close above the $1,050 resistance might set the pace for a larger move toward the $1,120 resistance. Any more gains might call for a test of the $1,150 zone in the near term.
Downside Correction?
If BNB fails to clear the $995 resistance, it could start another decline. Initial support on the downside is near the $980 level. The next major support is near the $970 level or the 50% Fib retracement level of the upward move from the $948 swing low to the $995 high.
The main support sits at $960. If there is a downside break below the $960 support, the price could drop toward the $940 support. Any more losses could initiate a larger decline toward the $920 level.
Technical Indicators
Hourly MACD – The MACD for BNB/USD is gaining pace in the bullish zone.
Hourly RSI (Relative Strength Index) – The RSI for BNB/USD is currently above the 50 level.
Major Support Levels – $970 and $960.
Major Resistance Levels – $995 and $1,000.
