Bitcoin Hits Critical Resistance – Fed Decision Poised to Ignite Major Price Movement

Bitcoin's back at a make-or-break level as traders brace for Powell's next move.
The Fed's playing with fire—and crypto's holding the matches.
Market tensions hit peak levels as institutional money waits on the sidelines. Another round of hawkish talk could send BTC tumbling—or trigger the mother of all short squeezes.
Meanwhile, traditional finance guys are still trying to figure out how to short something that never closes. Some things never change.
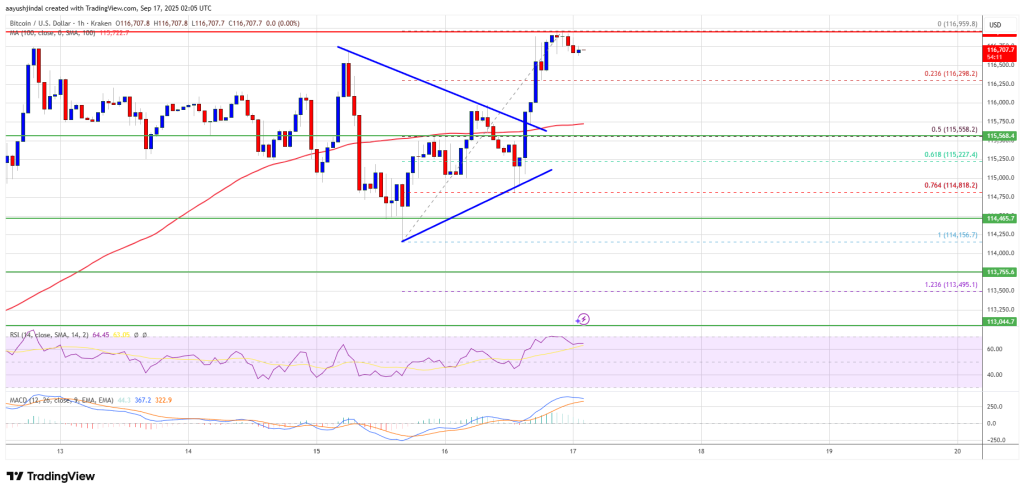
Bitcoin Price Hits Resistance
Bitcoin price started a fresh upward wave above the $114,500 zone. BTC managed to climb above the $115,000 and $115,500 resistance levels.
The bulls were able to push the price above $116,200 and $116,500. Besides, there was a break above a contracting triangle with resistance at $115,750 on the hourly chart of the BTC/USD pair. The price traded as high as $116,959 and is currently consolidating gains. It is stable above the 23.6% Fib retracement level of the recent MOVE from the $114,156 swing low to the $116,959 high.
Bitcoin is now trading above $116,000 and the 100 hourly Simple moving average. Immediate resistance on the upside is NEAR the $116,850 level. The first key resistance is near the $117,200 level.
The next resistance could be $117,500. A close above the $117,500 resistance might send the price further higher. In the stated case, the price could rise and test the $118,400 resistance level. Any more gains might send the price toward the $118,800 level. The next barrier for the bulls could be $119,250.
Another Decline In BTC?
If Bitcoin fails to rise above the $116,850 resistance zone, it could start a fresh decline. Immediate support is near the $116,250 level. The first major support is near the $115,550 level or the 50% Fib retracement level of the recent move from the $114,156 swing low to the $116,959 high.
The next support is now near the $115,200 zone. Any more losses might send the price toward the $114,500 support in the near term. The main support sits at $112,500, below which BTC might decline heavily.
Technical indicators:
Hourly MACD – The MACD is now gaining pace in the bullish zone.
Hourly RSI (Relative Strength Index) – The RSI for BTC/USD is now above the 50 level.
Major Support Levels – $115,550, followed by $115,200.
Major Resistance Levels – $116,850 and $117,200.
