Bitcoin Shatters Records: Last 18 Months’ Inflows Dwarf First 15 Years Combined

Bitcoin just rewrote its own history books—massive capital acceleration defies all conventional adoption curves.
The Unstoppable Surge
Forget gradual growth. Bitcoin's recent inflow explosion makes its first decade and a half look like a mere warm-up. We're talking about more capital flooding in during just the past 1.5 years than the entire first 15 years combined. That's not just growth—that's a tidal wave.
Wall Street's Late Arrival
Traditional finance finally caught on—way late, as usual. Institutional players, hedge funds, and even some formerly skeptical asset managers are now scrambling to get exposure. They spent years dismissing it, only to panic-buy at the worst possible moments. Classic.
What’s Driving the Rush?
Macro uncertainty, inflation fears, and a growing distrust in legacy financial systems are pushing smart money toward hard assets. Bitcoin’s finite supply and decentralized nature make it a natural hedge—something gold wishes it could still claim.
The New Financial Reality
This isn’t a bubble; it’s a fundamental shift. When inflows over 18 months outpace the first 15 years, you’re witnessing a phase change—not a trend. Traditional portfolios without Bitcoin exposure aren’t diversified; they’re obsolete.
And let’s be real—if your financial advisor still calls crypto a 'fad,' maybe it’s time to ask what else they’ve been wrong about for the past decade.
Bitcoin Realized Cap Shows Acceleration In Inflows Recently
In a new post on X, CryptoQuant founder and CEO Ki Young Ju has shared the trend in the Realized Cap of bitcoin over its entire history. The “Realized Cap” here refers to an on-chain indicator that measures, in short, the total amount of capital that the investors as a whole have put into the cryptocurrency.
When the value of this metric rises, it means the investors are feeding a net amount of capital into the network. On the other hand, it going down suggests the cryptocurrency is facing outflows.
Now, here is the chart shared by Young Ju that shows how the Realized Cap has developed over the history of Bitcoin:
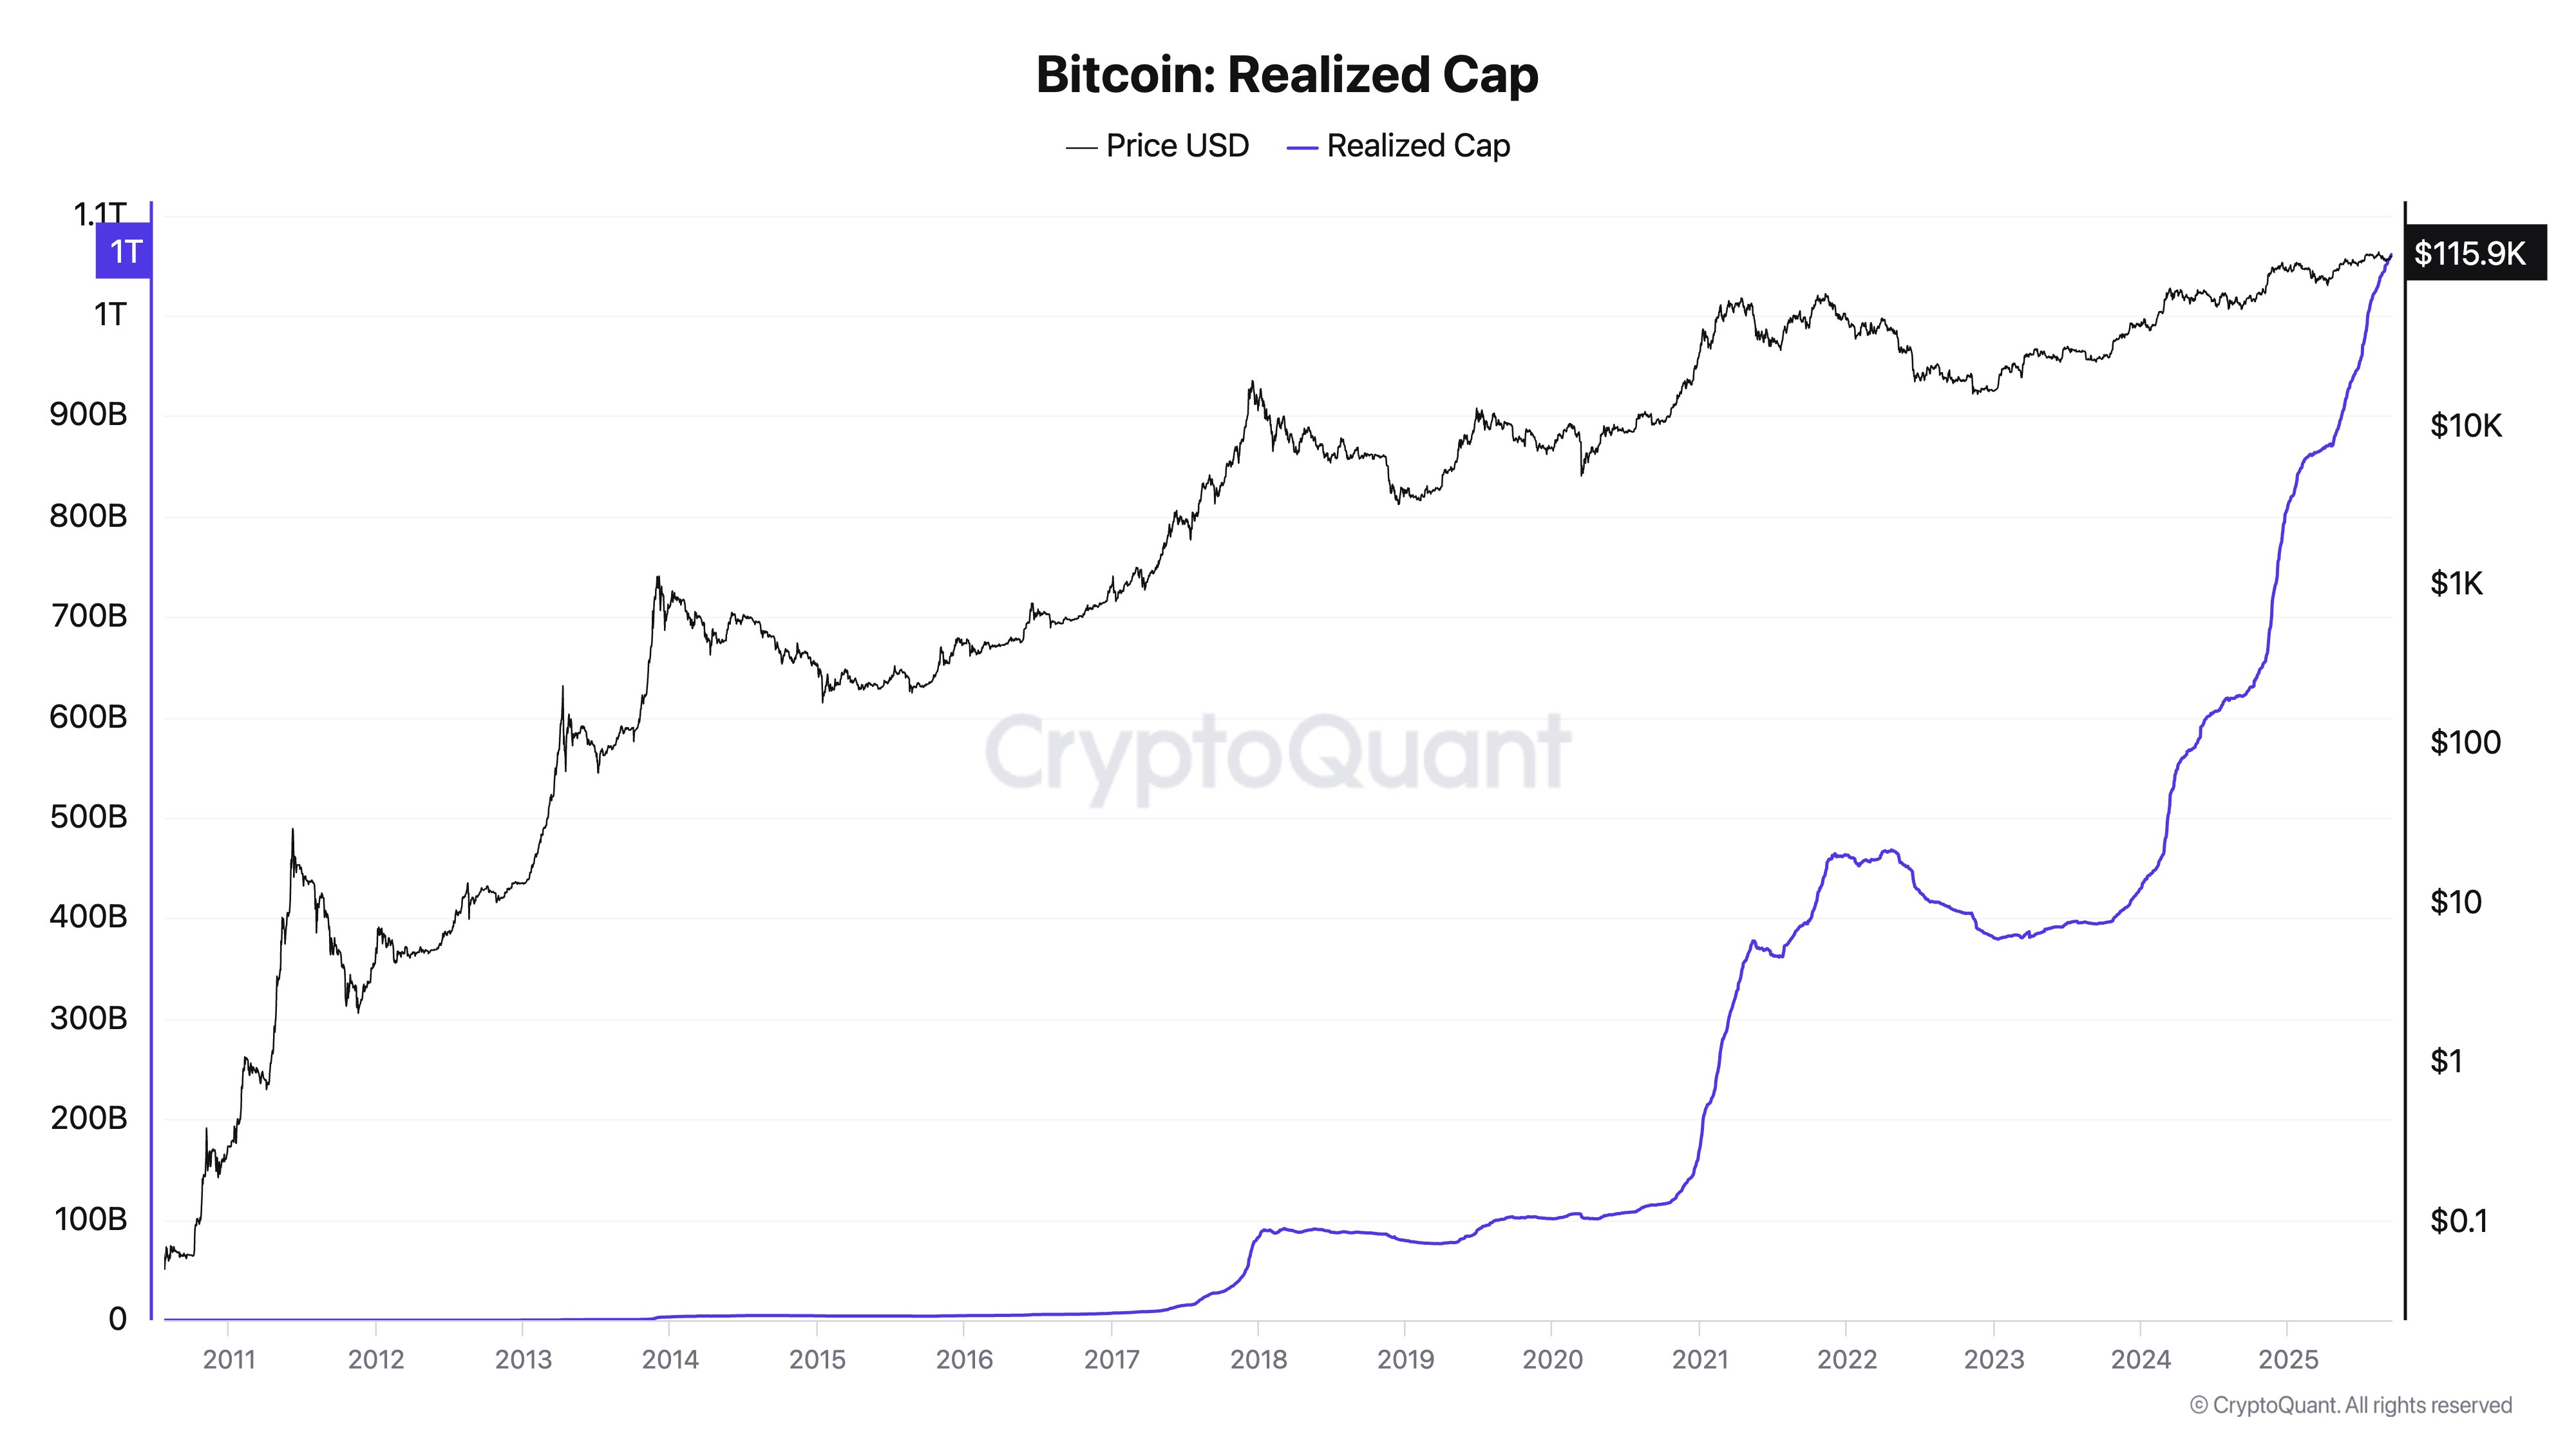
As displayed in the above graph, the Bitcoin Realized Cap saw an acceleration in 2024, implying capital started to enter into the digital asset at a faster rate. In the past year and a half, the metric has seen an explosive growth of $625 billion.
Interestingly, between 2009 and 2024, the Realized Cap cumulatively grew by $435 billion. This means that not only have recent capital flows overtaken these inflows that occurred over a much longer timespan, they have actually gained a notable distance.
The much sharper capital inflows are a reflection of how BTC is growing as an asset. A relatively modest amount of inflows may have been enough to double the asset’s value in the past, but today, a huge amount of capital is needed to MOVE the needle.
A new catalyst for growth this cycle has been in the FORM of the spot exchange-traded funds (ETFs). These investment vehicles allow investors to gain exposure to Bitcoin without having to own any sats themselves. This has made these funds a popular way to invest for the traditional traders unfamiliar with cryptocurrency wallets and exchanges, and brought in previously untapped capital.
In some other news, on-chain analytics firm Glassnode has shared an update on how Bitcoin investor cohort behavior has recently looked from the lens of the Accumulation Trend Score.
This indicator tells us about whether the BTC holders are buying or selling right now. Below is the chart posted by Glassnode that shows the trend in the metric for the various investor groups.

From the chart, it’s visible that the indicator is in the neutral-to-distribution region for all groups currently, a sign that the Bitcoin investors as a whole are in a phase of selling.
BTC Price
At the time of writing, Bitcoin is trading around $115,400, up 3% over the last week.
