XRP Plunges Below $3 – Will Bulls Spark a Lightning-Fast Recovery?

XRP just got hammered—dropping under the critical $3 threshold. Traders are scrambling as the digital asset faces its toughest test in weeks.
Market Whiplash
No fancy charts or complex indicators needed here—the price tells the story. XRP's sudden dip sends shockwaves through crypto circles, leaving holders wondering if this is a temporary stumble or the start of something uglier.
Bullish Gambits
Optimists point to historical rebounds—remember those jaw-dropping rallies? They’re betting on a repeat performance, banking on XRP’s notorious volatility to work in their favor this time.
Meanwhile, skeptics roll their eyes—another day, another crypto ‘opportunity’ that smells like leveraged hope and institutional manipulation. Because nothing says ‘healthy market’ like 20% swings before breakfast.
XRP Price Corrects Gains
XRP price started a downside correction below the $3.120 level, like Bitcoin and Ethereum. The price dipped below the $3.050 level to enter a short-term bearish zone.
There was a MOVE below the $3.00 pivot level and the 100-hourly Simple Moving Average. A low was formed at $2.957 and the price is now consolidating losses. There was a minor move above the 23.6% Fib retracement level of the downward move from the $3.186 swing high to the $2.957 low.
The price is now trading below $3.050 and the 100-hourly Simple Moving Average. Besides, there is a bearish trend line forming with resistance at $3.020 on the hourly chart of the XRP/USD pair.
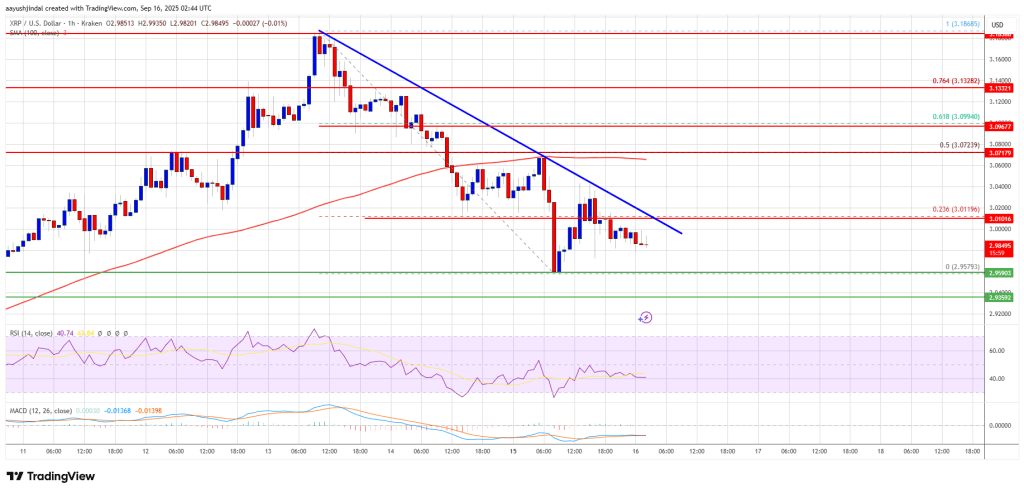
If the bulls protect the $2.950 support, the price could attempt another increase. On the upside, the price might face resistance NEAR the $3.020 level. The first major resistance is near the $3.050 level. A clear move above the $3.050 resistance might send the price toward the $3.120 resistance. Any more gains might send the price toward the $3.180 resistance. The next major hurdle for the bulls might be near $3.250.
More Downsides?
If XRP fails to clear the $3.020 resistance zone, it could continue to move down. Initial support on the downside is near the $2.950 level. The next major support is near the $2.920 level.
If there is a downside break and a close below the $2.920 level, the price might continue to decline toward $2.880. The next major support sits near the $2.840 zone, below which the price could gain bearish momentum.
Technical Indicators
Hourly MACD – The MACD for XRP/USD is now losing pace in the bearish zone.
Hourly RSI (Relative Strength Index) – The RSI for XRP/USD is now below the 50 level.
Major Support Levels – $2.950 and $2.920.
Major Resistance Levels – $3.020 and $3.050.

Log in to Reply
Log in to comment your thoughtsComments
Related Articles
|Square
Get the BTCC app to start your crypto journey
Get started today Scan to join our 100M+ users