Stellar Primed for Lunar Launch? XLM Price Prediction Signals 400% Explosion Imminent

Stellar's XLM isn't just climbing—it's rewriting the playbook on altcoin rallies. Forget gradual gains; analysts see a trajectory that leaves traditional finance scratching its head.
The Setup: Why This Isn't Another Pump
Institutional adoption finally meets cross-border utility. Stellar's network handles transactions that would make legacy banks sweat—settling in seconds for fractions of a cent. Meanwhile, Wall Street still charges $25 wire fees and takes three business days. The math isn't complicated.
The Catalyst: Real-World Use Beats Hype
Payment corridors expanding from Nigeria to the Philippines. CBDC pilots going live. This isn't speculative vaporware—it's infrastructure working while bankers debate their lunch orders. XLM's surge stems from utility, not influencer tweets.
The Target: 400% Isn't a Guess—It's Math
Current projections map directly to adoption metrics. Every new partnership adds another rocket booster. Traditional valuation models break down when network effects kick in. Sometimes exponential growth just… happens. Especially when you're bypassing the entire correspondent banking system.
The Bottom Line: Stellar's moment isn't coming—it's already here. And if the predictions hold? A few finance bros might finally notice that real innovation happens outside their marble lobbies.
Stellar (XLM) Set To Explode 400%
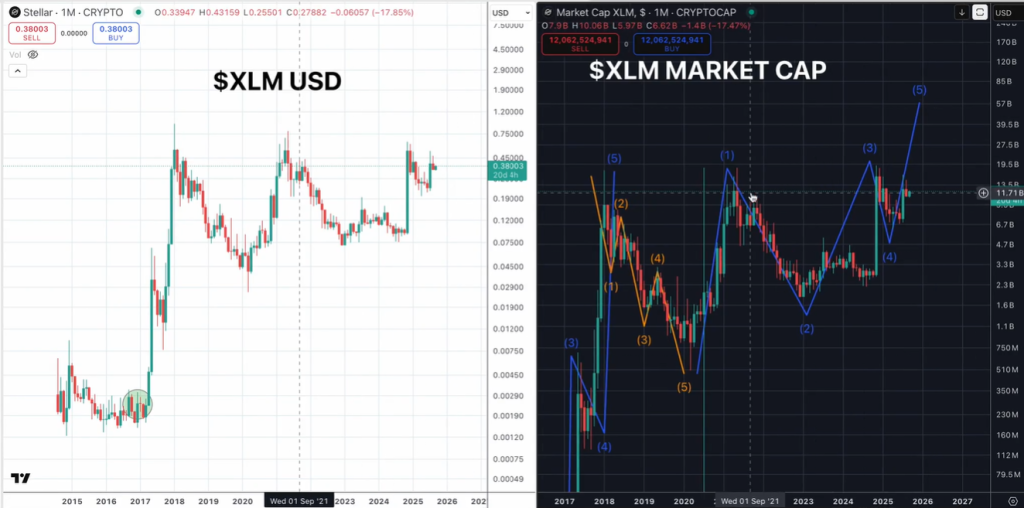
“Looking at this… the USD price is only up 12,000% while the market cap chart [is] up 52,000%. So… there is some kind of inflationary pressure on the asset… Stellar, we have to use the market cap chart to measure out exactly where the price is gonna go,” he said, before mapping Fibonacci extensions on the monthly and weekly time frames.
From a cycle that he dates to May 2016, the analyst counts five waves up into the January 2018 peak, five down into March 2020, and then a new, ongoing motive structure that has already printed waves one through four, with wave four “finished in April of this year.”
He highlights an “88% week” in July that he interprets as part of the transition into the terminal wave. The crux of his call comes from overlapping Fibonacci projections: measuring the third-to-fourth-wave drawdown and the larger 2021 range, he finds confluence NEAR the 3.618 extension, which places XLM’s fully diluted valuation zone between roughly $60 billion and $71 billion. “My primary there is going to be $60 billion on the market cap… could see a throw over there to that $71 [billion] as well,” he said.
Translating capitalization into a notional price path, Quantum Ascend frames a primary price objective around $1.96 per XLM—with a more aggressive extension near $2.28—while emphasizing adherence to Elliott Wave proportionality: “We’re looking at 400% or a 5X… everyone’s going to be screaming for $2; it’s going to end up at like $1.96… another reason that makes sense is that the third wave cannot be the shortest… I feel really good about that target right there.” The analyst also notes that a rapid, internally impulsive sub-structure is plausible for the fifth wave (“could see five waves in this fifth wave here pretty quick”), given the asset’s history of condensed moves.
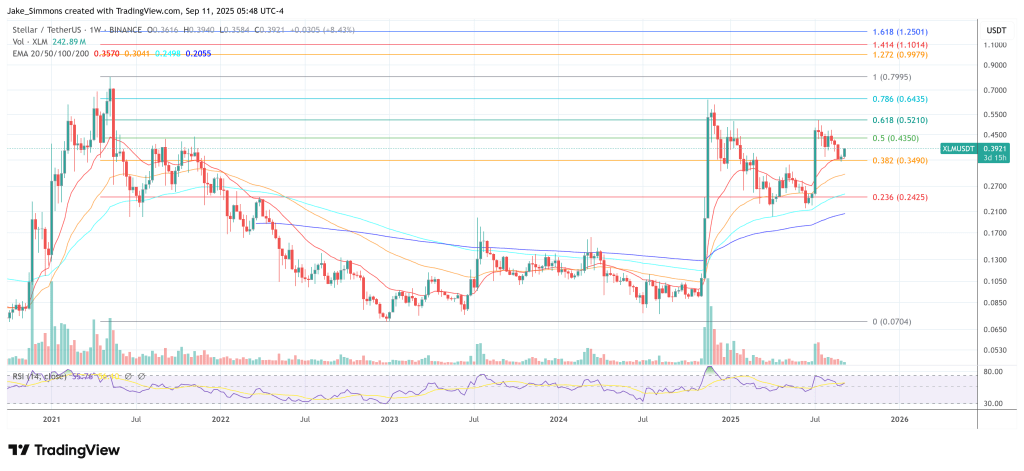
As of September 11, 2025, XLM changes hands around $0.386 with a market capitalization near $12.28 billion, per CoinMarketCap. A move to the analyst’s $60 billion primary target WOULD imply an appreciation on the order of ~4.9x from today’s valuation, with the precise dollar price contingent on circulating-supply conditions at the time of arrival.
Supply mechanics are a key backdrop to his market-cap emphasis. In November 2019, the stellar Development Foundation (SDF) reduced total XLM supply to ~50 billion via a 55 billion token burn; since then, no new lumens are created at the protocol level, although circulating supply has continued to evolve as SDF distributes treasury holdings over time. This helps explain why long-horizon market-cap curves can diverge from simple price charts, particularly when comparing epochs with different circulating float.
If realized, a primary target near $1.96 would set a new all-time high for XLM, exceeding the $0.938 peak recorded on January 4, 2018. That historical marker is relevant because, in Elliott terms, structurally new highs often validate the completion of a cycle’s terminal wave—though the analyst himself ties confirmation to the unfolding of the internal wave structure rather than to a single price print.
To be sure, Elliott counting and Fibonacci confluence are interpretive frameworks, not certainties. Macro liquidity, the path of Bitcoin dominance, and idiosyncratic issuance/distribution by large holders can all alter trajectories and timing. Still, for believers in cycle symmetry, Quantum Ascend’s case is straightforward: a high-time-timeframe fifth wave for XLM, projected at roughly $60 billion in market cap, equating to about a 400% rally from current levels—“just shy of $2” on price.