Solana (SOL) Breaks Resistance – How High Can It Fly in 2025?

Solana's native token SOL isn't just climbing—it's mooning past expectations. After a brutal crypto winter, the Ethereum rival just punched through key resistance levels. Here's why traders are scrambling.
The Speed Play Paying Off
SOL's blistering transactions and dirt-cheap fees keep stealing market share. While other chains drown in 'scaling solutions,' Solana just works—a rarity in this space.
Institutional Money Flooding In
Hedge funds that wouldn't touch crypto in 2022 are now quietly accumulating SOL positions. Nothing like FOMO to make Wall Street overcome its blockchain allergy.
The Cynic's Corner
Let's be real—half these buyers couldn't explain Solana's proof-of-history if their bonuses depended on it. But when the pumps on, nobody asks questions.
SOL's chart looks parabolic. Will it sustain the rally or face the inevitable 'up only' reckoning? Grab your popcorn.
Solana Price Eyes More Gains
Solana price started a decent increase after it found support near the $205 zone, beating Bitcoin and Ethereum. SOL climbed above the $212 level to enter a short-term positive zone.
The price even smashed the $218 resistance. The bulls were able to push the price above the $220 barrier. A high was formed at $226 and the price is consolidating gains above the 23.6% Fib retracement level of the upward MOVE from the $199 swing low to the $226 high.
Solana is now trading above $215 and the 100-hourly simple moving average. There is also a bullish trend line forming with support at $222 on the hourly chart of the SOL/USD pair.
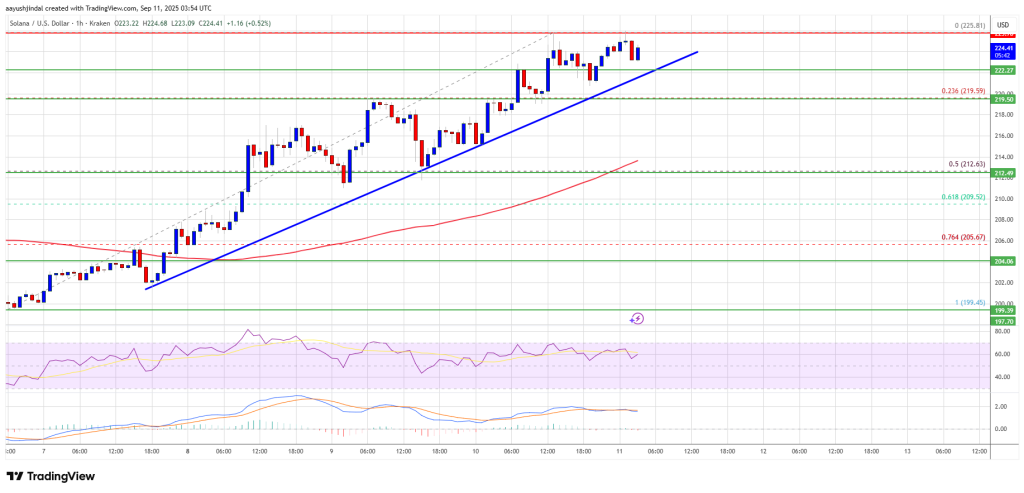
On the upside, the price is facing resistance NEAR the $225 level. The next major resistance is near the $232 level. The main resistance could be $235. A successful close above the $235 resistance zone could set the pace for another steady increase. The next key resistance is $245. Any more gains might send the price toward the $250 level.
Downside Correction In SOL?
If SOL fails to rise above the $225 resistance, it could start another decline. Initial support on the downside is near the $222 zone and the trend line. The first major support is near the $212 level or the 50% Fib retracement level of the upward move from the $199 swing low to the $226 high.
A break below the $212 level might send the price toward the $205 support zone. If there is a close below the $205 support, the price could decline toward the $200 support in the near term.
Technical Indicators
Hourly MACD – The MACD for SOL/USD is gaining pace in the bullish zone.
Hourly Hours RSI (Relative Strength Index) – The RSI for SOL/USD is above the 50 level.
Major Support Levels – $222 and $212.
Major Resistance Levels – $225 and $235.
