Bitcoin Bulls Brace for Impact – Is a Sharp Decline Imminent?

Bitcoin's relentless volatility keeps traders guessing as technical indicators flash warning signs.
Technical Breakdown
Key support levels loom dangerously close while resistance continues to stiffen – creating a perfect storm for potential downside movement. The market's breathing patterns suggest institutional players are positioning for another leg down.
Market Sentiment Shift
Fear's creeping back into crypto Twitter as leveraged long positions stack up like nervous dominoes. Retail enthusiasm meets institutional caution in what's becoming a classic showdown between hope and historical patterns.
Regulatory Shadows
Meanwhile, traditional finance veterans watch from the sidelines with that familiar mix of skepticism and secret FOMO – because nothing says 'sound investment' like watching your portfolio swing 20% before breakfast.
Bitcoin Price Remains At Risk
Bitcoin price started a fresh recovery wave from the $110,100 zone. BTC managed to climb above the $110,800 and $111,500 resistance levels.
The bulls were able to push the price above $112,500 and $113,000. However, the bears remained active NEAR the $113,200 zone and prevented more gains. There was a fresh bearish reaction, and the price traded below $112,000. A low was formed at $110,820 and the price is now consolidating losses.
Bitcoin is now trading below $111,500 and the 100 hourly Simple moving average. Besides, there is a bullish trend line forming with support at $111,000 on the hourly chart of the BTC/USD pair. Immediate resistance on the upside is near the $111,700 level. The first key resistance is near the $112,000 level. It is near the 50% Fib retracement level of the recent decline from the $113,200 swing high to the $110,820 low.
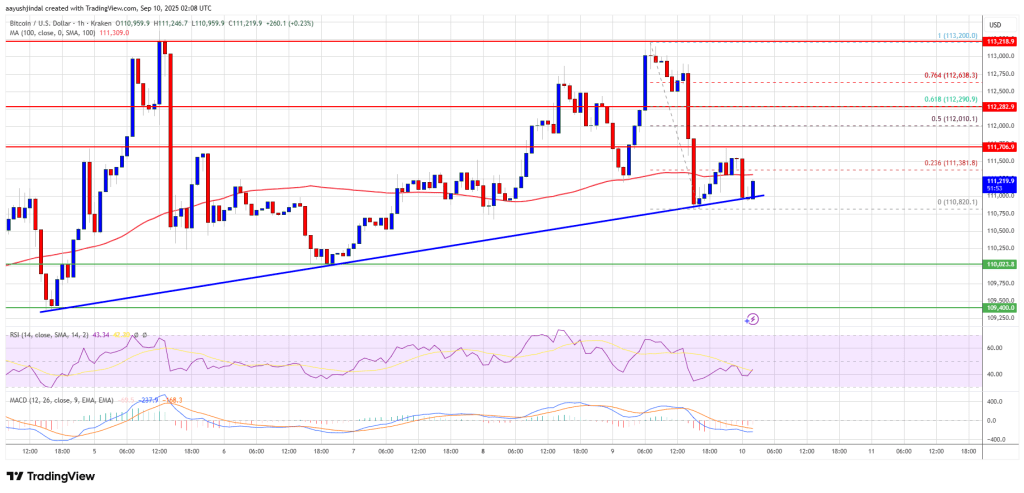
The next resistance could be $112,300 or the 61.8% Fib level of the recent decline from the $113,200 swing high to the $110,820 low. A close above the $112,300 resistance might send the price further higher. In the stated case, the price could rise and test the $113,200 resistance level. Any more gains might send the price toward the $114,200 level. The main target could be $115,000.
More Losses In BTC?
If Bitcoin fails to rise above the $112,300 resistance zone, it could start a fresh decline. Immediate support is near the $111,000 level and the trend line. The first major support is near the $110,800 level.
The next support is now near the $110,200 zone. Any more losses might send the price toward the $108,800 support in the near term. The main support sits at $107,500, below which BTC might decline sharply.
Technical indicators:
Hourly MACD – The MACD is now losing pace in the bullish zone.
Hourly RSI (Relative Strength Index) – The RSI for BTC/USD is now below the 50 level.
Major Support Levels – $111,000, followed by $110,200.
Major Resistance Levels – $112,000 and $112,300.
