Solana (SOL) Battles Intense Resistance – Will Bulls Defend the $200 Line?

Solana's momentum hits a wall as selling pressure mounts at critical levels.
Technical barriers loom large while traders watch for signs of bullish conviction.
The $200 psychological threshold becomes the next major battleground.
Market sentiment hangs in the balance as volatility spikes across crypto markets.
Another day, another resistance level—because what's crypto without its daily dose of emotional whiplash?
Solana Price Faces Resistance
Solana price started a decent increase from the $194-$195 zone, like Bitcoin and Ethereum. SOL was able to climb above the $200 and $202 resistance levels.
There was a clear move above the 50% Fib retracement level of the downward move from the $218 swing high to the $194 low. However, the bears seem to be active NEAR the $212 resistance zone. The price reacted to the downside below $210.
There was a break below a connecting bullish trend line with support at $207 on the hourly chart of the SOL/USD pair. solana is now trading above $204 and the 100-hourly simple moving average.
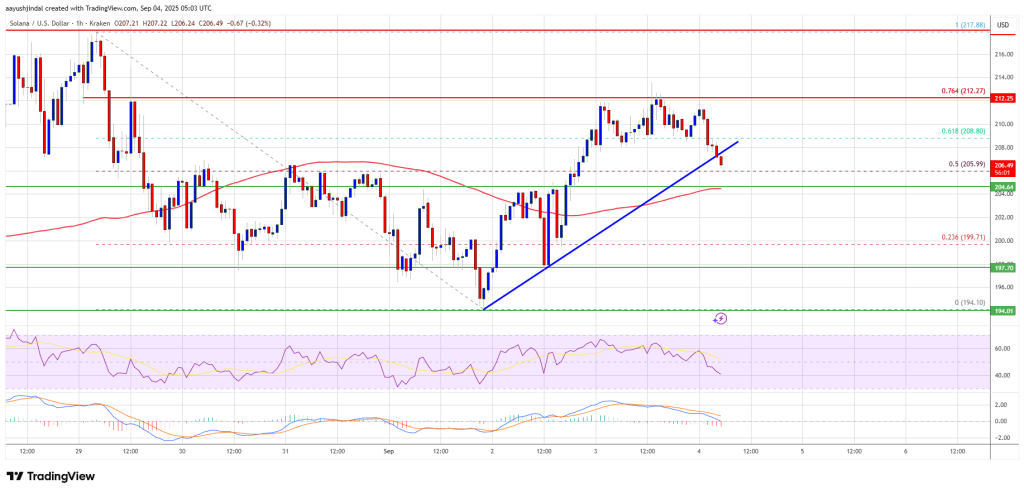
On the upside, the price is facing resistance near the $2102 level. The next major resistance is near the $212 level or the 76.4% Fib retracement level of the downward MOVE from the $218 swing high to the $194 low. The main resistance could be $218. A successful close above the $218 resistance zone could set the pace for another steady increase. The next key resistance is $232. Any more gains might send the price toward the $245 level.
Another Decline In SOL?
If SOL fails to rise above the $212 resistance, it could continue to move down. Initial support on the downside is near the $204 zone. The first major support is near the $200 level.
A break below the $200 level might send the price toward the $195 support zone. If there is a close below the $195 support, the price could decline toward the $184 support in the near term.
Technical Indicators
Hourly MACD – The MACD for SOL/USD is losing pace in the bullish zone.
Hourly Hours RSI (Relative Strength Index) – The RSI for SOL/USD is below the 50 level.
Major Support Levels – $200 and $195.
Major Resistance Levels – $212 and $218.
