Bitcoin’s Price Recovery Is Underway – But Does Momentum Tell a Different Story?

Bitcoin stages comeback as bulls push prices higher—but technical indicators flash warning signs.
The Momentum Question
While price action shows green candles, underlying momentum metrics hint at fragility. Trading volume hasn't matched the pump, and key resistance levels keep rejecting advances. Classic case of 'looks strong but feels weak'—the crypto special.
Market Mechanics Exposed
Whales move markets while retail chases pumps. Algorithmic trading amplifies moves in both directions, creating fakeouts that trap overeager positions. Remember: in crypto, liquidity matters more than Twitter sentiment.
Institutional players watch from the sidelines, waiting for clearer signals before deploying capital. Meanwhile, leverage flushes out weak hands during minor pullbacks. Same old story—just with higher stakes.
Finance's eternal lesson applies: if it looks too good to be true, some hedge fund probably already front-ran the trade.
Bitcoin Price Extends Recovery
Bitcoin price started a fresh recovery wave above the $109,500 zone. BTC was able to climb above the $110,000 and $110,500 resistance levels.
The price cleared the 61.8% Fib retracement level of the key drop from the $113,457 swing high to the $107,352 low. The upward MOVE was such that the price even surpassed the $112,000 resistance zone. Besides, there is a short-term rising channel forming with support at $111,500 on the hourly chart of the BTC/USD pair.
Bitcoin is now trading above $111,000 and the 100 hourly Simple moving average. Moreover, the price is now consolidating NEAR the 76.4% Fib retracement level of the key drop from the $113,457 swing high to the $107,352 low. Immediate resistance on the upside is near the $112,500 level.
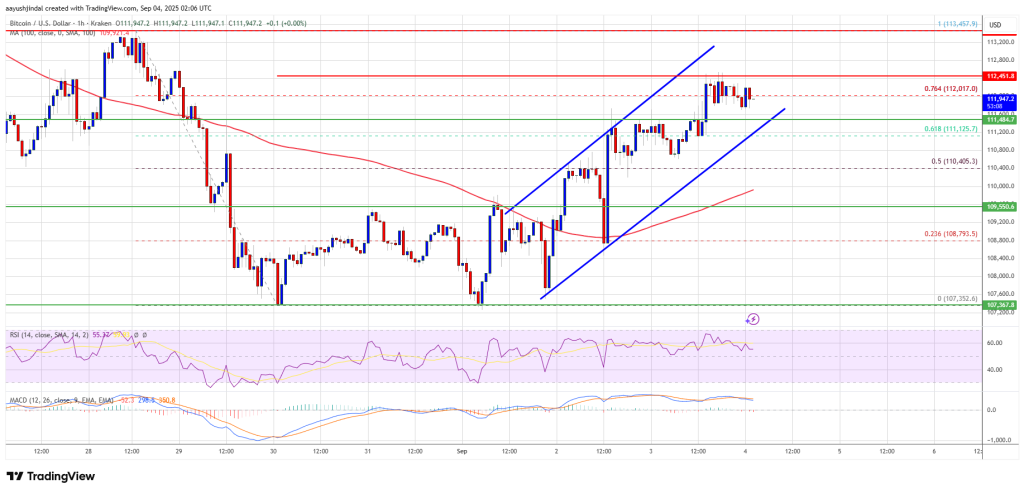
The first key resistance is near the $112,800 level. The next resistance could be $113,450. A close above the $113,450 resistance might send the price further higher. In the stated case, the price could rise and test the $114,500 resistance level. Any more gains might send the price toward the $115,000 level. The main target could be $115,500.
Another Pullback In BTC?
If Bitcoin fails to rise above the $112,500 resistance zone, it could start a fresh decline. Immediate support is near the $111,500 level. The first major support is near the $110,500 level.
The next support is now near the $110,000 zone. Any more losses might send the price toward the $109,250 support in the near term. The main support sits at $108,500, below which BTC might decline sharply.
Technical indicators:
Hourly MACD – The MACD is now gaining pace in the bullish zone.
Hourly RSI (Relative Strength Index) – The RSI for BTC/USD is now above the 50 level.
Major Support Levels – $111,500, followed by $110,000.
Major Resistance Levels – $112,500 and $113,450.
