Bitcoin Under Pressure: Technical Indicators Flash Warning for Another Sharp Decline

Bitcoin's technical setup screams trouble—another leg down looks imminent as key support levels crumble.
Chart Patterns Turn Ugly
Classic bearish formations are dominating Bitcoin's charts. Descending triangles and broken trendlines suggest traders are bracing for more pain. The momentum indicators aren't helping either—RSI dipping below key thresholds signals weakening buying interest.
Critical Support Test
All eyes are on whether Bitcoin can hold crucial support zones. A break below these levels could trigger automated sell-offs and margin calls—fueling the downward spiral. Remember when analysts promised 'institutional adoption would prevent these crashes'? So much for that theory.
Market psychology shifts fast in crypto—today's fear could be tomorrow's buying opportunity, but right now, the technicals aren't lying. Lower lows appear more likely than not.
Bitcoin Price Dips Again
Bitcoin price attempted a fresh recovery wave from the $108,734 low. BTC was able to climb above the $109,500 and $110,000 resistance levels.
The price surpassed the 23.6% Fib retracement level of the key drop from the $117,355 swing high to the $110,734 low. The bulls even pushed the price above the $112,500 resistance zone. However, the price struggled to stay above the $113,000 resistance.
It retreated from the 50% Fib level of the key drop from the $117,355 swing high to the $110,734 low. Besides, there was a break below a key bullish trend line with support at $112,000 on the hourly chart of the BTC/USD pair.
Bitcoin is now trading below $112,000 and the 100 hourly Simple moving average. Immediate resistance on the upside is NEAR the $112,400 level. The first key resistance is near the $113,000 level. The next resistance could be $113,500.
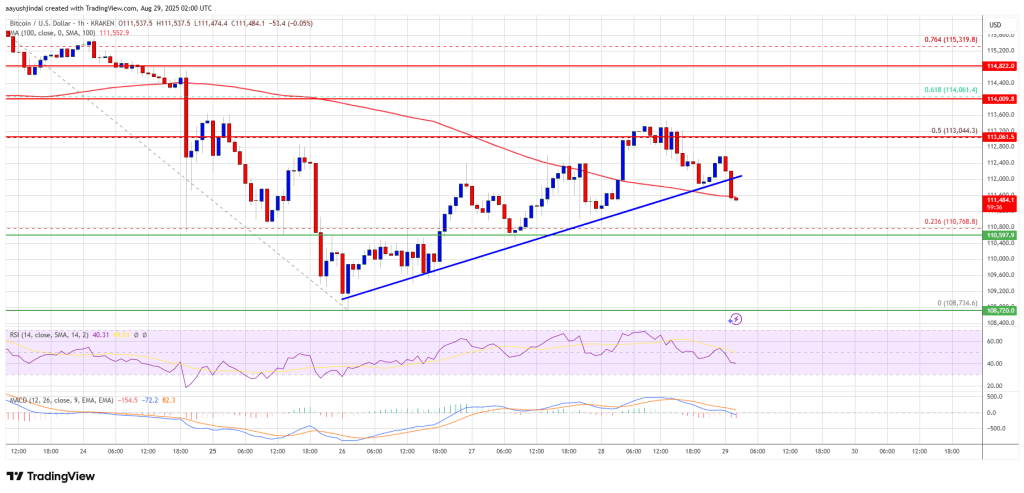
A close above the $113,500 resistance might send the price further higher. In the stated case, the price could rise and test the $114,000 resistance level. Any more gains might send the price toward the $115,500 level. The main target could be $116,500.
More Losses In BTC?
If Bitcoin fails to rise above the $113,000 resistance zone, it could start a fresh decline. Immediate support is near the $110,750 level. The first major support is near the $110,000 level.
The next support is now near the $109,500 zone. Any more losses might send the price toward the $108,500 support in the near term. The main support sits at $106,500, below which BTC might decline sharply.
Technical indicators:
Hourly MACD – The MACD is now gaining pace in the bearish zone.
Hourly RSI (Relative Strength Index) – The RSI for BTC/USD is now below the 50 level.
Major Support Levels – $110,750, followed by $109,500.
Major Resistance Levels – $112,500 and $113,000.

Log in to Reply
Log in to comment your thoughtsComments
Related Articles
|Square
Get the BTCC app to start your crypto journey
Get started today Scan to join our 100M+ users