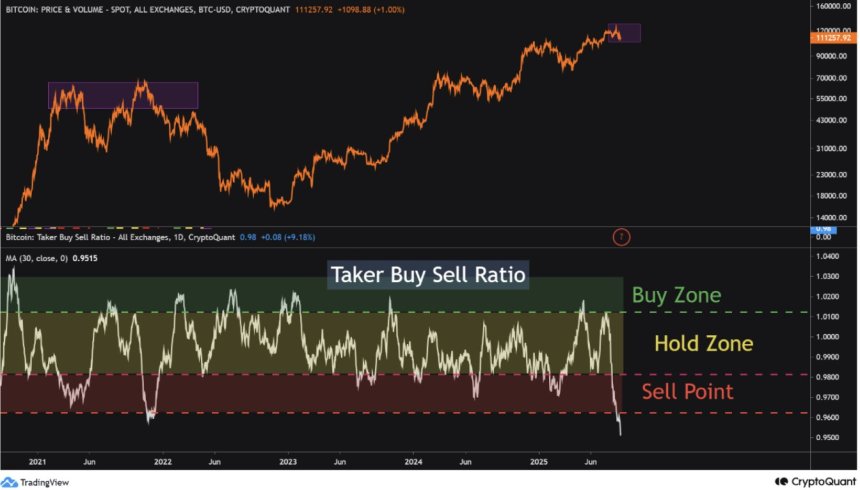
Bitcoin Taker Buy/Sell Ratio Crashes to 2018 Lows: Strongest Sell Signal in Years
Bitcoin's market structure flashes red as the taker buy/sell ratio hits its lowest point since 2018—a classic signal that heavy selling pressure is dominating the market.
Market Mechanics Breakdown
The ratio's plunge suggests institutional and large-scale traders are aggressively taking sell-side liquidity rather than buying. Market depth charts show ask walls getting demolished while bid support remains thin.
Historical Context Matters
Previous instances of such extreme ratios preceded significant price corrections. The 2018 parallel saw Bitcoin drop another 40% within weeks—though today's matured market structure might offer more resilience.
Traders React
Futures markets show increasing short positions while spot volumes indicate distribution patterns. Options traders pile into puts, hedging against further downside despite the 'cost of insurance' hitting multi-month highs.
Silver Lining Playbook
Seasoned accumulators see blood in the streets as opportunity. Previous cycle lows in this ratio marked excellent long-term entry zones—because nothing makes traditional finance guys sweat like crypto volatility except maybe their own bonus calculations.
Bitcoin Data Reveals Strong Sell Signal
The latest CryptoOnchain report highlights concerning data from CryptoQuant’s chart, which tracks the 30-day moving average of Bitcoin’s Taker Buy/Sell Ratio. This metric is a reliable gauge of market balance, showing whether aggressive buyers or sellers dominate trading activity. Currently, the sharp decline in this moving average points to a clear weakening of buying pressure. More importantly, the ratio has now slipped below the critical 0.98 threshold — a level widely regarded as a strong sell-off signal.

Falling under this line indicates that selling activity is decisively outpacing buying demand. In practical terms, it suggests that the market is leaning heavily toward distribution rather than accumulation, with investors more eager to offload positions than to build them. Historically, when the ratio has dipped to such levels, Bitcoin has struggled to maintain upward momentum and often faced steep retracements.
While Bitcoin’s price has recently held near pivotal support zones, this imbalance between buyers and sellers raises doubts about the sustainability of current levels. The chart reflects an environment where Optimism is fragile and downside risks are elevated.
CryptoOnchain explains that the drop in the 30-day moving average of the Taker Buy/Sell Ratio serves as a clear warning. Unless this trend reverses quickly, Bitcoin may be vulnerable to a deeper short-term correction, and potentially the start of a more prolonged downward phase in the cycle.
Bulls Hold Crucial Support After Sharp PullbackBitcoin is currently trading NEAR $111,000 after a volatile retracement from local highs above $123,000 earlier this month. The chart highlights a decisive shift in momentum: after repeatedly failing to break through the $124,000 resistance zone, BTC lost steam and rolled over, triggering a wave of selling pressure.

Price action has since pushed Bitcoin below the 50-day and 100-day moving averages, both now trending downward and reinforcing a short-term bearish outlook. The 200-day moving average around $114,100 is also being tested from below, acting as resistance instead of support. This flip underscores the challenges facing bulls as they attempt to stabilize the market.
For now, BTC is finding support in the $110,000–$111,000 range, a level that coincides with consolidation zones from earlier in the summer. If buyers can hold this line, a relief bounce toward $114,000–$116,000 is possible, though reclaiming those levels will be crucial to regaining momentum.
Failure to defend current support, however, could expose Bitcoin to further downside risk, with the next major demand zone near $105,000. Market sentiment remains fragile, and the inability to clear resistance at $124,000 has shifted focus toward the resilience of support levels in the weeks ahead.
Featured image from Dall-E, chart from TradingView

