Is $105,000 The Bitcoin Bull Run Killer Or Just Market Noise? Top Analyst Breaks It Down
Bitcoin's $105,000 resistance level sparks fierce debate among analysts—is this the bull run's breaking point or mere psychological noise?
The Price Wall Debate
Market watchers clash over whether this number represents genuine technical resistance or just another round of trader psychology playing out. Some see it as a critical barrier that could define the next market cycle, while others dismiss it as arbitrary round-number obsession that always surfaces near all-time highs.
Institutional Impact vs. Retail Sentiment
Large players continue accumulating despite the price tension, while retail traders oscillate between FOMO and fear. The $105,000 level becomes a battleground between macro adoption trends and short-term trader emotions—because nothing says 'mature asset class' like everyone panicking over a round number.
Historical Patterns or New Paradigm?
Past cycles suggest resistance levels often break amid sustained institutional demand, but current market dynamics differ fundamentally from previous eras. The real question isn't the number itself but whether underlying adoption metrics support continued upward movement despite psychological barriers.
Ultimately, price targets are just coordinates on a chart—the real story unfolds in adoption rates, regulatory clarity, and whether the traditional finance crowd finally understands what they're buying besides hype.
How Low Could Bitcoin Price Go?
The posts point back to a YouTube video published two weeks ago, where the analyst maps three paths for Bitcoin’s next leg. Two envision an upside reversal in or just below the current $107,000–$110,000 area, while a third allows for a deeper corrective sweep without violating the secular uptrend.
He is explicit that trend invalidation for the cycle sits much lower—he cites the “mid-$70,000s” as the line in the sand, and, in one passage, places formal invalidation at $74,000–$75,000—because that’s where the prior high-time-frame impulse originated and where the market would, in Elliott-wave terms, erase the larger five-wave structure. That framing is why losing $105,000 WOULD mark a deterioration in momentum rather than a terminal break in structure.
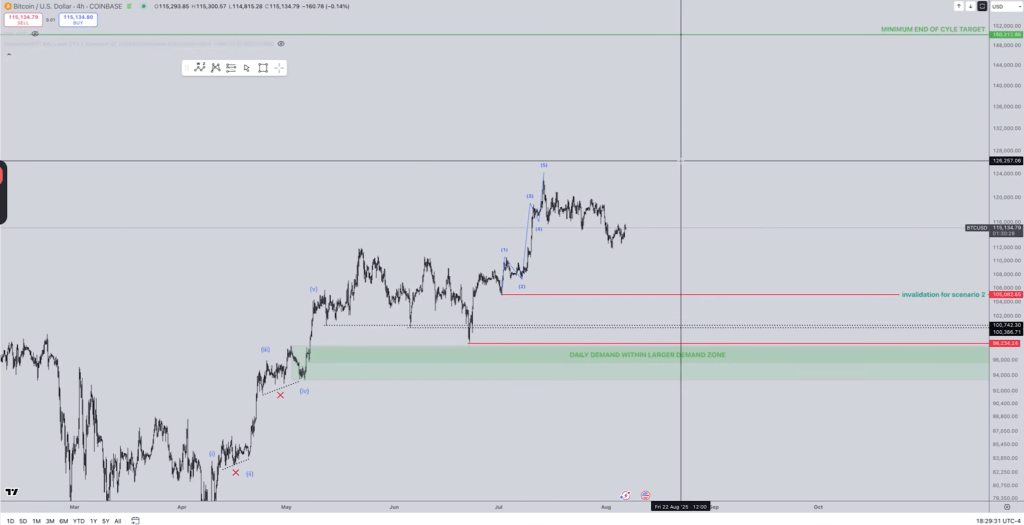
Inside his framework, “Scenario 1”—the idea that price is still working through a compact fourth-wave pause inside an already active impulse—has, by his own admission, grown unlikely. The corrective chop has lasted too long and retraced too DEEP relative to its second-wave analogue; by classical proportionality, that makes it the wrong degree for a fourth wave. The technical red line for that scenario was $110,000; once reclaimed and then overrun to the downside during the correction, the count’s symmetry broke down.
“Scenario 2,” his preferred bullish configuration, casts the rally off roughly $105,000 as the first completed five-wave impulse of a new advance. In this reading, the market is currently tracing a wave-two pullback with invalidation squarely at $105k.
The implication is arithmetic as much as it is structural: if wave one spanned approximately $20,000 top to bottom, a standard third wave would be larger, pushing toward at least the mid-$130,000s before a fourth-wave pause and a terminal fifth carry the MOVE into the $150,000-plus region. This is why he characterizes $107,000–110,000 as “the best R:R for longs,” the last high-probability staging area for a reversal before invalidation.

“Scenario 3” keeps the broader May-to-present correction intact. Here the pop above range highs was corrective rather than impulsive—what technicians call a three-leg rise with overlap—and the market still owes a deeper sweep into demand.
He differentiates two shapes: a running flat that defends the June/July lows and finds support in a purple band between ~$103,000 and ~$98,000, and an expanded flat that undercuts those lows and tests the daily demand block that “started at basically 98k,” which price “front-ran… at 98.2k” before bouncing. In both cases the higher-time-frame thesis is unchanged, because the structural invalidation remains far below at $74k–$75k.
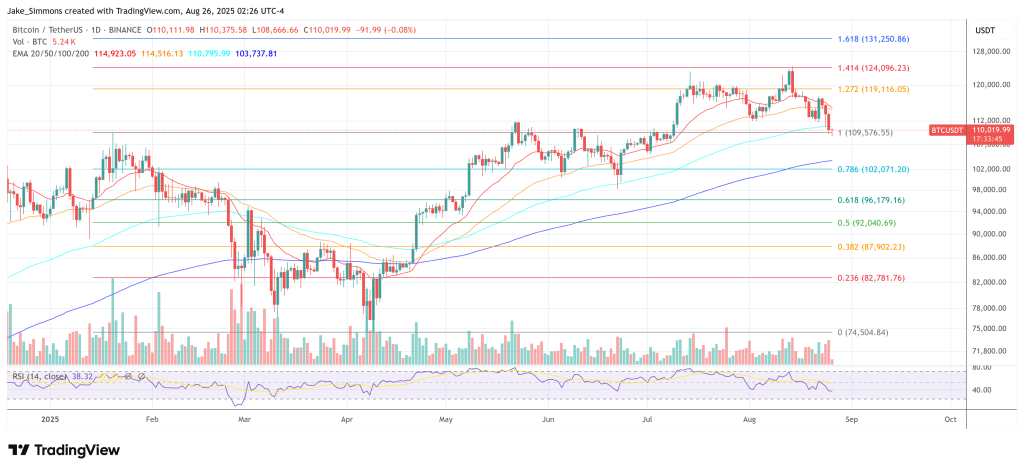
At press time, BTC traded around $110,019 after hitting an intraday low at $108,666.


