Bitcoin Plunges Below $110K: Is This the Start of a Major Correction?

Bitcoin's relentless rally hits a wall as prices tumble below the critical $110,000 threshold. Traders are scrambling—is this just a healthy pullback or the beginning of something more severe?
Market Mechanics Under Pressure
The drop below six figures sends shockwaves through derivatives markets. Leveraged positions get liquidated while spot buyers hesitate—classic volatility feeding on itself. Remember what happens when too many people ride the same trade?
Institutional Whispers vs. Retail Fear
Big money isn't panicking yet—they've seen this movie before. Meanwhile, retail investors check portfolios every three minutes. The divergence in sentiment couldn't be more stark. Wall Street calls it 'profit-taking'; Main Street calls it a heart attack.
Technical Breakdown or Opportunity?
Key support levels shattered like cheap china. Fibonacci retracements get redrawn faster than a politician's promise. But here's the thing—every major crypto dip eventually gets bought. Until one doesn't.
Macro Winds Shifting
Traditional markets wobble as crypto bleeds—correlation or coincidence? Fed policy whispers echo through both arenas. Suddenly those 'digital gold' narratives feel awfully heavy.
Bottom Line: Crypto winter coming or just a cold shower? Either way—maybe don't check your portfolio before bedtime. (Though let's be real—you absolutely will.)
Bitcoin Price Dips Further
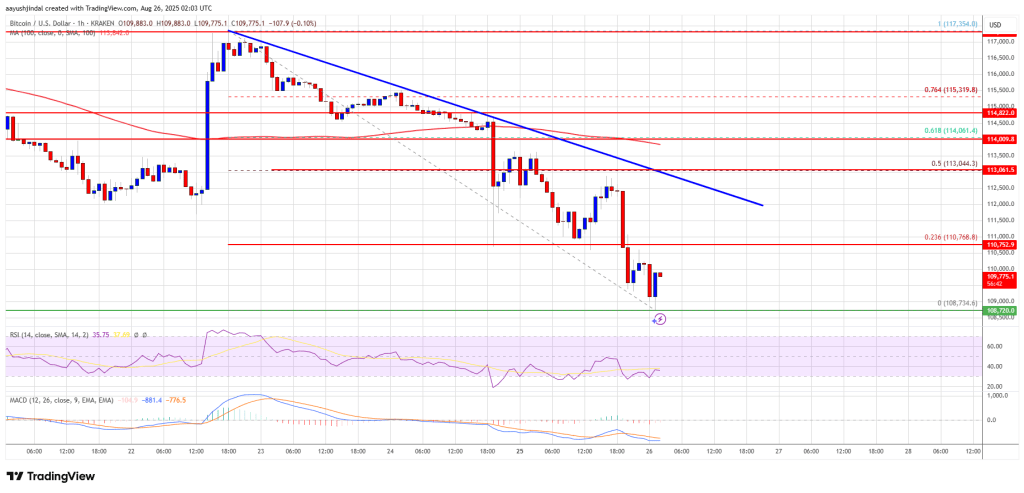
Bitcoin price started a fresh decline after a close below the $113,500 level. BTC gained bearish momentum and traded below the $112,000 support zone.
There was a move below the $110,000 support zone and the 100 hourly Simple moving average. The pair tested the $108,750 zone. A low was formed at $108,734 and the price is now attempting to recover. It climbed above $109,500 but is still below the 23.6% Fib retracement level of the recent decline from the $117,354 swing high to the $110,692 low.
Bitcoin is now trading below $112,000 and the 100 hourly Simple moving average. Immediate resistance on the upside is NEAR the $110,750 level. The first key resistance is near the $112,500 level. There is also a key bearish trend line forming with resistance at $112,500 on the hourly chart of the BTC/USD pair.
The next resistance could be $113,000 or the 50% Fib retracement level of the recent decline from the $117,354 swing high to the $110,692 low. A close above the $113,000 resistance might send the price further higher.
In the stated case, the price could rise and test the $114,500 resistance level. Any more gains might send the price toward the $115,500 level. The main target could be $116,500.
Another Decline In BTC?
If Bitcoin fails to rise above the $112,000 resistance zone, it could start a fresh decline. Immediate support is near the $108,500 level. The first major support is near the $107,200 level.
The next support is now near the $106,500 zone. Any more losses might send the price toward the $105,500 support in the near term. The main support sits at $103,500, below which BTC might accelerate lower.
Technical indicators:
Hourly MACD – The MACD is now gaining pace in the bearish zone.
Hourly RSI (Relative Strength Index) – The RSI for BTC/USD is now below the 50 level.
Major Support Levels – $108,500, followed by $117,200.
Major Resistance Levels – $110,500 and $112,500.
