Solana (SOL) Shatters $200 Barrier - Bulls Eye Next Major Breakout

Solana smashes through psychological resistance as momentum builds toward historic highs.
The Breakout Nobody Saw Coming
SOL didn't just cross $200—it blew past it with conviction. Trading volumes surged 40% as institutional money finally woke up to what retail traders knew months ago. The network's handling 3,000+ transactions per second while Ethereum's still figuring out its coffee order.
Where Bulls Take Aim Next
Traders are stacking positions ahead of what could be the most explosive rally since the last cycle. Shorts got liquidated faster than a crypto exchange during a bull run. The $250 level now stands as the next major test—break that, and we're talking potential run toward all-time highs.
Meanwhile, traditional finance guys are still arguing about whether blockchain is 'legitimate' while missing every single major move. Their loss—Solana's proving that speed, scalability, and actual utility matter more than legacy brand names. The train's leaving the station, and Wall Street's still reading the timetable.
Solana Price Aims For More Gains
Solana price started a decent increase after it found support near the $188 zone, unlike Bitcoin and like Ethereum. SOL climbed above the $195 level to enter a short-term positive zone.
The price even smashed the $202 resistance. The bulls were able to push the price above the $208 barrier. A high was formed at $213 and the price is consolidating gains above the 23.6% Fib retracement level of the upward MOVE from the $177 swing low to the $213 high.
Solana is now trading above $200 and the 100-hourly simple moving average. There is also a rising channel forming with support at $205 on the hourly chart of the SOL/USD pair.
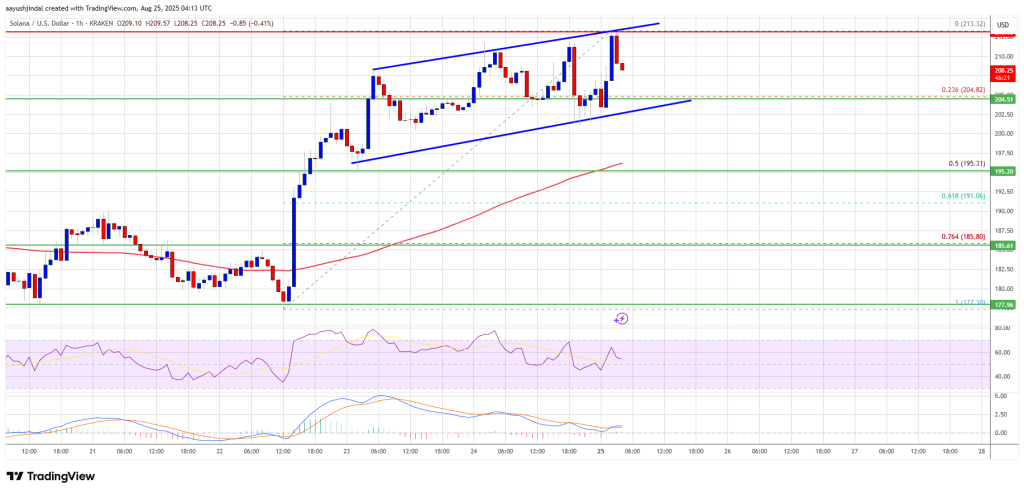
On the upside, the price is facing resistance NEAR the $212 level. The next major resistance is near the $215 level. The main resistance could be $220. A successful close above the $220 resistance zone could set the pace for another steady increase. The next key resistance is $225. Any more gains might send the price toward the $232 level.
Downside Correction In SOL?
If SOL fails to rise above the $212 resistance, it could start another decline. Initial support on the downside is near the $205 zone. The first major support is near the $202 level.
A break below the $202 level might send the price toward the $195 support zone and the 50% Fib retracement level of the upward move from the $177 swing low to the $213 high. If there is a close below the $195 support, the price could decline toward the $188 support in the near term.
Technical Indicators
Hourly MACD – The MACD for SOL/USD is gaining pace in the bullish zone.
Hourly Hours RSI (Relative Strength Index) – The RSI for SOL/USD is above the 50 level.
Major Support Levels – $205 and $195.
Major Resistance Levels – $212 and $215.
