Bitcoin Bulls Battle Red: Can They Reclaim Lost Ground Soon?

Bitcoin's bleeding continues—another day painted crimson across crypto dashboards worldwide. The digital gold standard struggles to find footing as bearish momentum persists.
Technical Tug-of-War
Support levels crumble like stale breadcrumbs. Each bounce gets weaker, each sell-off sharper. Trading volumes scream caution while leverage flushes out—classic capitulation patterns emerging across exchanges.
Whale Watching Intensifies
Big money stays sidelined, watching retail traders panic-sell at discounts they'll regret by next quarter. Institutional accumulation continues quietly—because nothing makes hedge funds happier than fearful markets offering fire-sale prices.
The Psychological Battlefield
Traders chase shadows while HODLers reinforce convictions. This dance repeats every cycle—yet somehow Wall Street 'experts' still act surprised when volatility returns to volatile assets.
Regulatory spectres loom while traditional finance dinosaurs debate relevance—as if permissioned blockchains could ever compete with pure cryptographic truth.
Will bulls rally? History says yes. Patience says wait. And that cynical fund manager who called crypto a scam? He's probably accumulating positions through offshore shells right now.
Bitcoin Price Faces Resistance
Bitcoin price started a fresh decline after a close below the $115,000 level. BTC gained bearish momentum and traded below the $113,200 support zone.
There was a MOVE below the $112,500 support zone and the 100 hourly Simple moving average. The pair tested the $112,000 zone. A low was formed at $112,100 and the price is now attempting to recover toward the 23.6% Fib retracement level of the recent decline from the $124,420 swing high to the $112,100 low.
Bitcoin is now trading below $114,000 and the 100 hourly Simple moving average. Immediate resistance on the upside is NEAR the $113,500 level. There is also a key bearish trend line forming with resistance at $113,500 on the hourly chart of the BTC/USD pair.
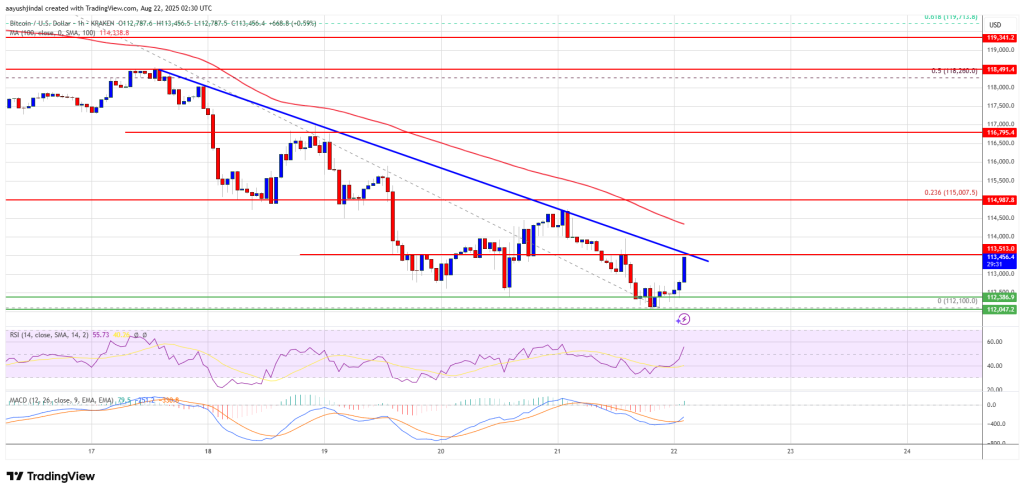
The first key resistance is near the $114,500 level. The next resistance could be $115,000. A close above the $115,000 resistance might send the price further higher. In the stated case, the price could rise and test the $116,500 resistance level. Any more gains might send the price toward the $118,200 level. It is close to the 50% Fib retracement level of the recent decline from the $124,420 swing high to the $112,100 low. The main target could be $120,000.
More Downside In BTC?
If Bitcoin fails to rise above the $114,500 resistance zone, it could start a fresh decline. Immediate support is near the $112,500 level. The first major support is near the $112,000 level.
The next support is now near the $110,500 zone. Any more losses might send the price toward the $108,250 support in the near term. The main support sits at $105,500, below which BTC might take a major hit.
Technical indicators:
Hourly MACD – The MACD is now losing pace in the bearish zone.
Hourly RSI (Relative Strength Index) – The RSI for BTC/USD is now above the 50 level.
Major Support Levels – $112,500, followed by $112,000.
Major Resistance Levels – $113,500 and $115,000.
