Solana (SOL) Surges Again - Can Bulls Maintain Momentum?

Solana rockets upward as bullish traders push for another breakout.
Technical Breakout Pattern
SOL's price action screams momentum - breaking through resistance levels like they're regulatory suggestions. The chart shows classic bullish continuation signals that even traditional finance analysts might actually understand.
Market Sentiment Shift
Traders pile in while skeptics watch from the sidelines. Volume spikes suggest this isn't just another fakeout pump - though in crypto, that's always the multi-million dollar question.
Key Resistance Battle
The real test comes at previous highs where profit-takers lurk. Bulls need to hold this ground or face the classic crypto retracement that makes portfolio statements painful to open.
Meanwhile, Wall Street still can't decide if this is the future of finance or just digital gambling with better marketing - but hey, at least the transaction fees are lower than their prime brokerage statements.
Solana Price Eyes Steady Increase
Solana price extended losses after there was a close below $188, like Bitcoin and Ethereum. SOL traded below the $185 and $108 support levels to enter a short-term bearish zone.
A low was formed at $175 and the price is now attempting a fresh increase. The price surpassed the $180 and $182 resistance levels. There was a MOVE above the 23.6% Fib retracement level of the downward move from the $210 swing high to the $175 low.
Besides, there was a break above a connecting bearish trend line with resistance at $183 on the hourly chart of the SOL/USD pair. solana is now trading above $182 and the 100-hourly simple moving average.
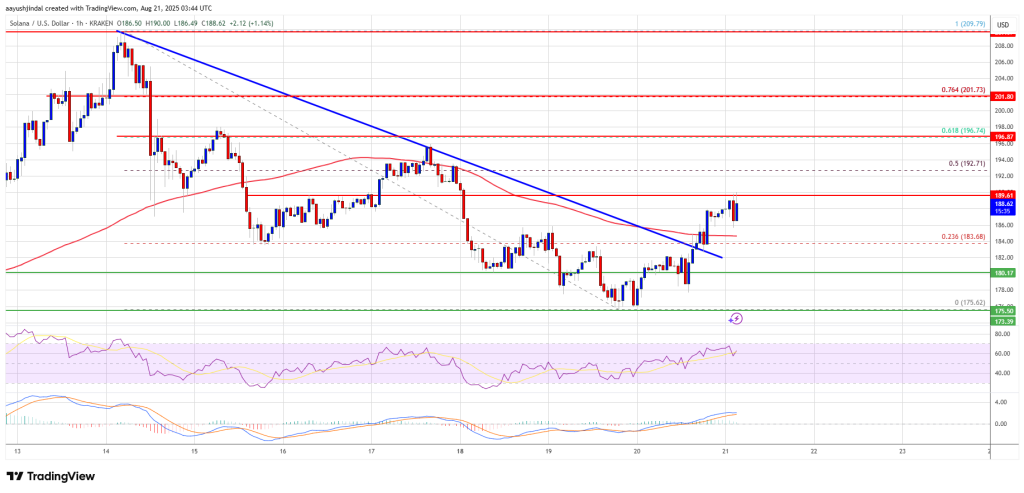
On the upside, the price is facing resistance NEAR the $188 level. The next major resistance is near the $192 level or the 50% Fib retracement level of the downward move from the $210 swing high to the $175 low. The main resistance could be $195. A successful close above the $195 resistance zone could set the pace for another steady increase. The next key resistance is $200. Any more gains might send the price toward the $210 level.
Another Decline In SOL?
If SOL fails to rise above the $188 resistance, it could continue to move down. Initial support on the downside is near the $184 zone. The first major support is near the $180 level.
A break below the $180 level might send the price toward the $175 support zone. If there is a close below the $175 support, the price could decline toward the $166 support in the near term.
Technical Indicators
Hourly MACD – The MACD for SOL/USD is gaining pace in the bullish zone.
Hourly Hours RSI (Relative Strength Index) – The RSI for SOL/USD is above the 50 level.
Major Support Levels – $180 and $175.
Major Resistance Levels – $188 and $192.
