XRP Price Recovery Stalls—Fresh Signs Point to Renewed Selling Pressure Ahead

XRP's comeback just hit a wall. After clawing back some gains, the token’s momentum is fading fast—and the charts are flashing warning signs that another sell-off could be brewing.
Technical Breakdown
Key support levels are cracking. Resistance is stiff. And volume? Drying up when it matters most. That’s not a dip—it’s a trapdoor.
Market Sentiment Shift
Traders are getting twitchy. Long positions are getting squeezed, shorts are piling in, and the ‘buy the dip’ crowd is suddenly a lot quieter. Classic signs of fatigue—and fear.
Broader Crypto Context
Bitcoin’s stalling, altcoins are leaking, and regulatory whispers aren’t helping. XRP isn’t operating in a vacuum—it’s caught in the same storm as everyone else. Only it might be taking on more water.
Outlook: Brace or Fade?
If this level breaks, it could get messy fast. Next support isn’t pretty. And if the macros turn? Let’s just say the ‘digital asset revolution’ still bows to old-school panic. Typical finance—everyone’s a genius in a bull market.
XRP Price Recovery Faces Hurdles
XRP price remained in a bearish zone after a close below the $3.050 level, like Bitcoin and Ethereum. The price extended losses and traded below the $3.00 support zone.
The price even declined below $2.90. Finally, it tested the $2.820 support zone. A low was formed at $2.820 and the price recently corrected some losses. There was a MOVE above the $2.90 level. The price surpassed the 50% Fib retracement level of the downward move from the $3.095 swing high to the $2.820 low.
However, the bears are active below the $3.00 level and the 61.8% Fib retracement level of the downward move from the $3.095 swing high to the $2.820 low. There is also a bearish trend line forming with resistance at $2.9650 on the hourly chart of the XRP/USD pair.
The price is now trading below $2.950 and the 100-hourly Simple Moving Average. On the upside, the price might face resistance NEAR the $2.950 level. The first major resistance is near the $2.9650 level.
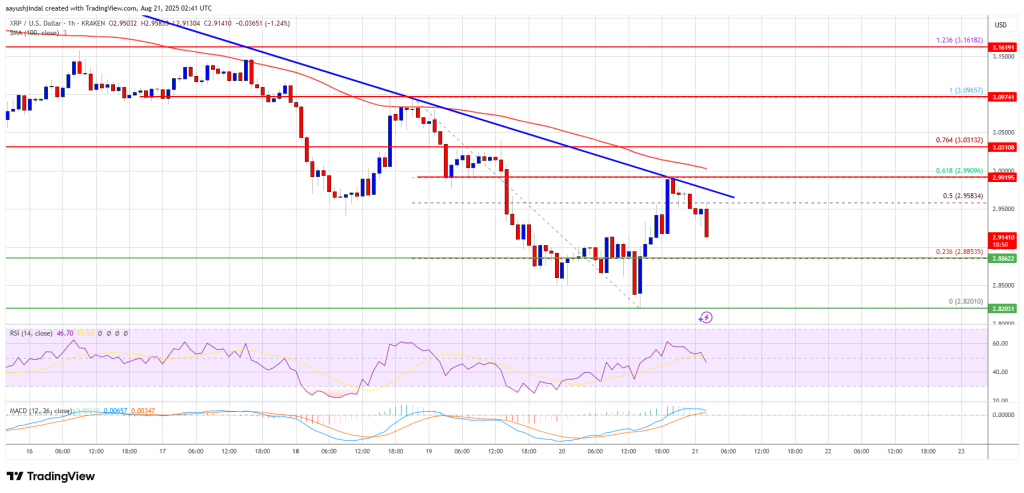
A clear move above the $2.9650 resistance might send the price toward the $3.00 resistance. Any more gains might send the price toward the $3.050 resistance. The next major hurdle for the bulls might be near $3.120.
Another Decline?
If XRP fails to clear the $2.9650 resistance zone, it could start a fresh decline. Initial support on the downside is near the $2.90 level. The next major support is near the $2.850 level.
If there is a downside break and a close below the $2.850 level, the price might continue to decline toward the $2.820 support. The next major support sits near the $2.780 zone, below which there could be a sustained drop.
Technical Indicators
Hourly MACD – The MACD for XRP/USD is now gaining pace in the bearish zone.
Hourly RSI (Relative Strength Index) – The RSI for XRP/USD is now below the 50 level.
Major Support Levels – $2.90 and $2.850.
Major Resistance Levels – $2.9650 and $3.00.
