Bitcoin’s Bearish Grip Tightens as Slide Extends Into Critical Territory
Bitcoin's brutal selloff deepens as bears seize control—prices tumble through key support levels with no bottom in sight.
The Technical Breakdown
Momentum indicators flash oversold signals while volume spikes confirm distribution patterns. Each bounce gets sold aggressively as institutional whales and retail panic converge.
Market Psychology Shift
Fear replaces greed faster than a leveraged long gets liquidated. Traders who chased the rally now face the harsh reality of crypto's volatility—where 20% drops qualify as 'normal market adjustments.'
Traditional Finance Watches
Wall Street analysts suddenly remember Bitcoin 'isn't a real asset' while quietly adding to positions. The same institutions that dismissed crypto now cite 'structural concerns' during dips—because nothing builds credibility like hindsight analysis.
This isn't a dip—it's a reality check. Markets don't go up forever, especially when fueled by memes and margin. But if history's any guide, today's panic will look like a buying opportunity in six months. Unless it doesn't—because in crypto, certainty is the most expensive illusion money can't buy.
Bitcoin Price Dips Further
Bitcoin price started a fresh decline after a close below the $118,000 level. BTC gained bearish momentum and traded below the $116,500 support zone.
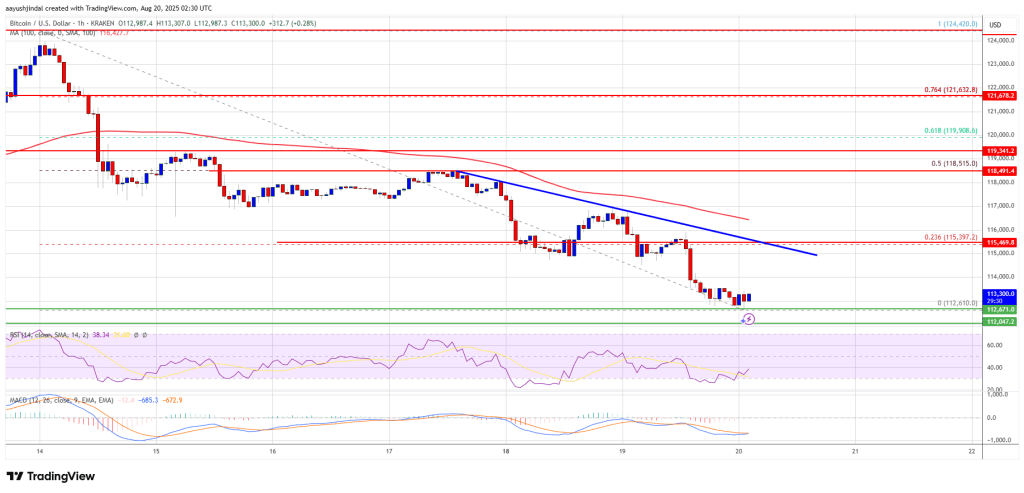
There was a MOVE below the $115,500 support zone and the 100 hourly Simple moving average. The pair tested the $112,500 zone. A low was formed at $112,610 and the price is now consolidating below the 23.6% Fib retracement level of the recent decline from the $124,420 swing high to the $112,610 low.
Bitcoin is now trading below $116,000 and the 100 hourly Simple moving average. Immediate resistance on the upside is NEAR the $114,200 level. The first key resistance is near the $115,000 level. There is also a key bearish trend line forming with resistance at $115,400 on the hourly chart of the BTC/USD pair.

The next resistance could be $115,500. A close above the $115,500 resistance might send the price further higher. In the stated case, the price could rise and test the $118,500 resistance level. It is close to the 50% Fib retracement level of the recent decline from the $124,420 swing high to the $112,610 low. Any more gains might send the price toward the $120,000 level. The main target could be $121,500.
More Losses In BTC?
If Bitcoin fails to rise above the $115,000 resistance zone, it could start a fresh decline. Immediate support is near the $112,500 level. The first major support is near the $112,000 level.
The next support is now near the $110,500 zone. Any more losses might send the price toward the $110,000 support in the near term. The main support sits at $108,000, below which BTC might take a major hit.
Technical indicators:
Hourly MACD – The MACD is now gaining pace in the bearish zone.
Hourly RSI (Relative Strength Index) – The RSI for BTC/USD is now below the 50 level.
Major Support Levels – $112,500, followed by $110,500.
Major Resistance Levels – $115,000 and $115,500.

