Bitcoin Defies Gravity: 30-Day CDD Plummets as Market Shrugs Off Long-Term Holder Selling

Bitcoin's resilience hits new highs—literally. Despite long-term holders cashing in, the king of crypto refuses to buckle. Here's why.
The Silent Absorption
Market depth eats LTH sell pressure for breakfast. No support levels broken, no panic—just steady hands stacking sats while weak wallets fold.
CDD Nosedive: What It Really Means
30-day Coin Days Destroyed crashing signals one thing: diamond hands aren't sweating. The 'smart money' narrative gets another bullet point as institutions quietly back up the truck.
Wall Street's FOMO Playbook
Watch traditional finance 'discover' Bitcoin's stability—right after their fifth espresso and third spreadsheet model. By then, the ship's already sailed.
Bottom line? Bitcoin does what Bitcoin does—ignores noise, breaks flawed assumptions, and makes overleveraged shorts regret life choices. The CDD slump isn't just data—it's a middle finger to volatility doomsayers.
Bitcoin Selling Pressure Eases As CDD Drops
According to top analyst Darkfost, the Coin Days Destroyed (CDD) indicator remains one of the most reliable tools for gauging selling pressure, particularly from long-term holders (LTHs). The metric measures how long a bitcoin has been held before being moved, essentially combining both volume and coin age. In most cases, older BTC are moved in preparation for selling, making CDD spikes a strong indicator of distribution phases in the market.
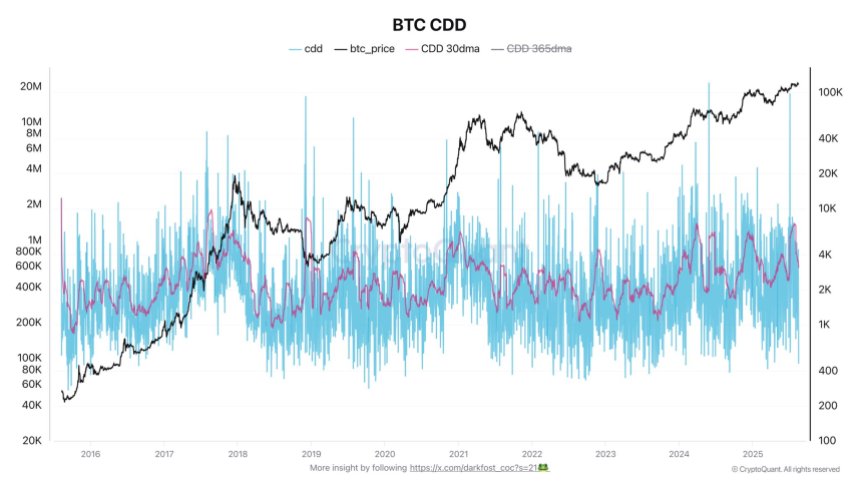
On July 23rd, the 30-day moving average of CDD surged to its highest level of this cycle, reaching nearly 1.35 million. This suggested that a significant amount of long-held Bitcoin was moved — and likely sold — as investors looked to lock in profits at or NEAR record prices. Despite this wave of selling, however, Bitcoin’s price action has held up remarkably well, signaling robust demand and the ability of the market to absorb supply without major breakdowns.
Since late July, this selling pressure has notably eased. The 30-dma CDD has been steadily declining throughout August, indicating fewer older coins are hitting the market. This trend highlights renewed stability and suggests accumulation is regaining dominance over distribution.
For Bitcoin’s broader outlook, the decline in CDD is a bullish signal. It shows that despite profit-taking, strong demand underpins current price levels, allowing BTC to consolidate near highs. If this trend continues, the groundwork may be laid for another leg higher in the ongoing bull cycle.
Price Analysis: Testing Key Support Level
Bitcoin is consolidating just below its recent all-time high, with the chart showing clear resistance at $123,217. After briefly touching the $124K region, BTC retraced and is now trading around $117,497, sitting on top of key moving averages. The 50-day SMA (~$117,337) is acting as immediate short-term support, while the 100-day SMA (~$115,366) provides an additional safety net for bulls. The 200-day SMA (~$110,551) remains far below, reflecting the strong momentum of the current uptrend.

The structure suggests indecision, with buyers defending support but failing to break above the $123K–$124K zone. A clean breakout above this level could open the path toward $130K and beyond, confirming continuation of the bull run. Conversely, a breakdown below $115K WOULD signal weakness and expose BTC to deeper retracements.
Momentum indicators suggest consolidation, not distribution, which aligns with the broader narrative of long-term holders selling into strength while new buyers step in. This healthy churn has allowed Bitcoin to sustain high levels without collapsing, a sign of structural resilience.
Featured image from Dall-E, chart from TradingView
