Bitcoin STH SOPR-7d Hits Bullish Signal: Market Devours Sell Pressure Like a Hungry Whale

Bitcoin's short-term holders just flashed a rare green light—and the market's gobbling up every coin dumped its way.
The metric that separates weak hands from diamond hands
When the Spent Output Profit Ratio (SOPR) for coins held 3-6 months stays above 1 during pullbacks, it means new buyers refuse to sell at a loss. This time? The 7-day average (STH SOPR-7d) held firm like a Bitcoin maxi at a goldbug convention.
Absorption mode activated
Every time some paperhand tries to 'sell the news,' institutions and OTC desks chew through the supply faster than a crypto bro through a VC-subsidized steak. Even with Grayscale's daily outflows, spot ETFs keep stacking sats like there's no tomorrow—which, given fiat inflation rates, might not be wrong.
One cynical footnote: Wall Street finally understands HODLing... just as retail starts day-trading shitcoins again.
Moderate Selling Pressure Hits Bitcoin
According to top analyst Axel Adler, Bitcoin’s Short-Term Holder Spent Output Profit Ratio (STH SOPR-7d) remains in a healthy range, with amplitude still moderate and well below the peaks of 1.06–1.09 seen in previous bullish waves. This indicates that selling pressure from short-term holders is not extreme, even as BTC trades NEAR its all-time highs.

Adler notes that the bullish scenario hinges on maintaining the SOPR-7d above 1.00–1.02, as values above unity mean that short-term holders are, on average, selling at a profit — and the market is absorbing that supply without triggering a larger sell-off. Ideally, brief pullbacks toward 1.00 should be met with strong buying interest, as quick rebounds from unity historically confirm robust demand.
However, the analyst cautions that if SOPR dips below 1.0 and stays there, it WOULD signal weakening demand. This shift would increase the probability of a deeper market correction, as it implies that coins are being sold at a loss and buyers are not stepping in aggressively enough to absorb them.
The coming days will be pivotal for Bitcoin’s short-term trajectory. Many analysts see BTC pushing decisively above $125,000 as the next major breakout level. Others, however, remain cautious, expecting the market to face a sharp retracement before resuming its upward trend.
Bitcoin Tests Resistance After Sharp Rejection from New Highs
Bitcoin’s daily chart shows the cryptocurrency recently tested a new all-time high near $124,000 before facing swift rejection, pulling back to current levels around $118,777. This drop marks a failure to sustain momentum above the crucial $123,217 resistance zone, highlighted in yellow on the chart.
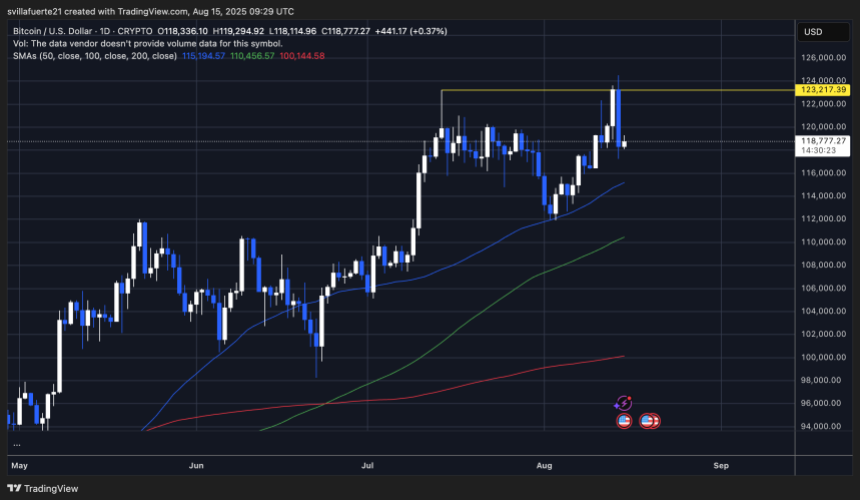
Despite the rejection, BTC remains well-supported above the 50-day moving average (blue), currently near $115,194. This level has consistently acted as a dynamic support during the 2025 uptrend. The 100-day MA (green) at $110,456 and the 200-day MA (red) at $100,144 remain far below, underscoring the strength of the broader bullish structure.
The consolidation below resistance reflects a market pausing to digest recent gains. For bulls, reclaiming $123,217 and closing above $124,000 would signal renewed momentum and could open the path toward $125,000 and beyond. A break below the 50-day MA could trigger a deeper pullback, with the 100-day MA as the next support.
Featured image from Dall-E, chart from TradingView
