Bitcoin Stalls Below $120K—Is This the Calm Before the Bull Run?

Bitcoin's price action has flatlined under the $120K resistance level—leaving traders wondering if the bulls are gearing up for another charge or if fatigue is setting in.
Sideways trading dominates as volatility evaporates
The king of crypto has been stuck in a tight range for weeks, with neither bulls nor bears able to force a decisive breakout. Liquidity pools are thinning, and derivatives traders are growing restless—classic signs of a coiled spring.
Will institutional FOMO finally push BTC past $120K?
With spot ETF inflows steady but unspectacular, the market’s waiting for a catalyst. BlackRock’s latest filing hints at fresh capital waiting in the wings, but Wall Street’s ‘risk-on’ switch remains stubbornly stuck in neutral. Meanwhile, retail traders keep overleveraging—some things never change.
Prepare for fireworks—or another fakeout
Technical indicators scream ‘overbought,’ but since when did Bitcoin care about RSI? The next move could hinge on whether macro traders start treating BTC like ‘gold 2.0’ or just another speculative asset. Either way, buckle up—when this consolidation breaks, it’ll move fast. And remember: in crypto, the ‘smart money’ is usually just the lucky money.
Bitcoin Price Holds Key Support
Bitcoin price failed to extend gains above $122,250 and started a downside correction. BTC corrected gains and traded below the $121,200 support zone.
There was a move below the $120,500 level. The price dipped below the 50% Fib retracement level of the upward move from the $116,282 swing low to the $122,272 high. Finally, the price spiked below the $118,500 support and tested the 100 hourly Simple moving average.
Bitcoin is now trading above $118,000 and the 100 hourly Simple moving average. There is also a bullish trend line forming with support at $118,600 on the hourly chart of the BTC/USD pair.
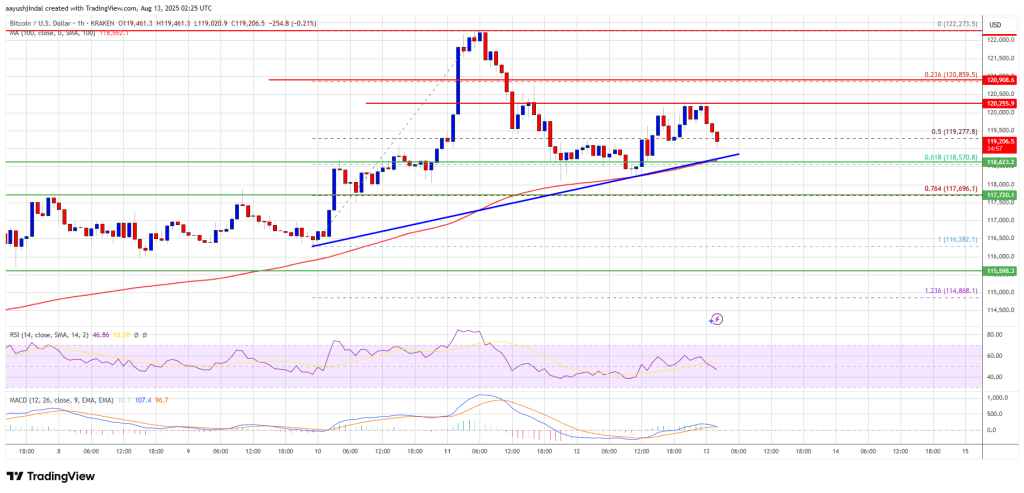
Immediate resistance on the upside is NEAR the $120,000 level. The first key resistance is near the $120,250 level. The next resistance could be $120,850. A close above the $120,850 resistance might send the price further higher. In the stated case, the price could rise and test the $122,250 resistance level. Any more gains might send the price toward the $124,000 level. The main target could be $125,000.
More Losses In BTC?
If Bitcoin fails to rise above the $120,500 resistance zone, it could start another decline. Immediate support is near the $118,600 level or the 61.8% Fib retracement level of the upward move from the $116,282 swing low to the $122,272 high. The first major support is near the $117,800 level.
The next support is now near the $116,550 zone. Any more losses might send the price toward the $115,500 support in the near term. The main support sits at $113,500, below which BTC might continue to move down.
Technical indicators:
Hourly MACD – The MACD is now losing pace in the bullish zone.
Hourly RSI (Relative Strength Index) – The RSI for BTC/USD is now below the 50 level.
Major Support Levels – $118,600, followed by $117,800.
Major Resistance Levels – $120,250 and $120,850.
