BNB Primed for Explosive Breakout—New ATHs Incoming?

BNB coils tighter than a spring—pressure building for a violent upside resolution.
Technical setup screams bullish: Symmetrical triangle on the daily chart approaches its apex. Volume drying up just before the pop—classic accumulation play.
Key levels to watch: A clean break above $650 opens the floodgates toward $800+. Only the suits still doubting this rally (probably busy shorting Tesla instead).
Market makers love this setup: Low liquidity traps get squeezed hardest. Retail FOMO hasn't even started yet—wait for the 'BNB to $1K' tweets to flood in.
One cynical truth? The same whales accumulating now will dump the top onto momentum chasers. Such is crypto.
BNB Price Holds Support
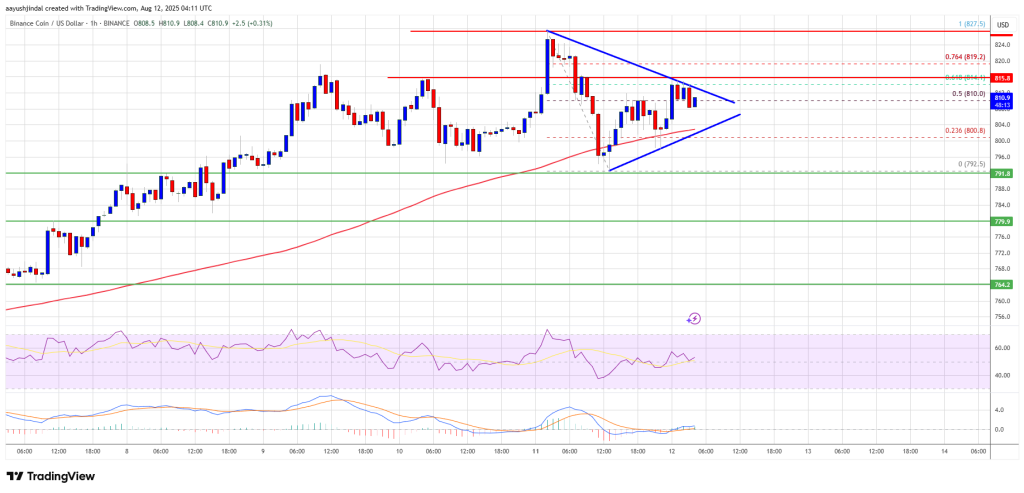
After a steady increase, BNB price failed to clear the $830 zone. There was a downside correction below the $820 and $815 levels, like Ethereum and Bitcoin.
The price even dipped below $800 and tested $792. A low was formed at $792 and the price is now attempting a fresh increase. There was a MOVE above the 50% Fib retracement level of the downward move from the $827 swing high to the $792 low.
The price is now trading above $810 and the 100-hourly simple moving average. There is also a key contracting triangle forming with support at $804 on the hourly chart of the BNB/USD pair.
On the upside, the price could face resistance near the $815 level or the 61.8% Fib retracement level of the downward move from the $827 swing high to the $792 low. The next resistance sits near the $820 level. A clear move above the $820 zone could send the price higher.
In the stated case, BNB price could test $832. A close above the $832 resistance might set the pace for a larger move toward the $840 resistance. Any more gains might call for a test of the $850 level in the near term.
Another Decline?
If BNB fails to clear the $815 resistance, it could start another decline. Initial support on the downside is near the $804 level. The next major support is near the $800 level.
The main support sits at $792. If there is a downside break below the $792 support, the price could drop toward the $780 support. Any more losses could initiate a larger decline toward the $768 level.
Technical Indicators
Hourly MACD – The MACD for BNB/USD is gaining pace in the bullish zone.
Hourly RSI (Relative Strength Index) – The RSI for BNB/USD is currently above the 50 level.
Major Support Levels – $804 and $792.
Major Resistance Levels – $815 and $820.
