Ethereum Primed for $12K Surge? ETH Mirrors Bitcoin’s 2020 Bull Run Fractal

History might be repeating itself—with Ethereum now playing Bitcoin’s 2020 breakout role. A chillingly similar chart pattern suggests ETH could be gearing up for a parabolic rally toward $12,000.
The Fractal That’s Making Traders Sweat
Remember when Bitcoin defied gravity three years ago? Ethereum’s current consolidation echoes BTC’s pre-bull market consolidation with unsettling precision. The same coiled-spring energy. The same whisper network of institutional interest.
Why $12K Isn’t Just Hopium
Market cycles don’t repeat, but they rhyme—and this technical setup rhymes harder than a Wall Street analyst justifying their sixth yacht. Key resistance levels are breaking like stale promises in a bear market.
The Cynical Kick
Of course, if the pattern fails, some VC will just call it ‘a healthy recalibration’ before dumping their bags on retail. Welcome to crypto.
ETH Price To Soar By 182% In The Coming Months: Analyst
In an August 9 post on the social media platform X, pseudonymous crypto analyst Titan of Crypto shared an exciting layout for ethereum that could see its price climb as high as $12,000. This positive projection is based on the price fractals of the world’s largest cryptocurrency by market capitalization, Bitcoin, in 2020.
In technical analysis, fractals refer to the recurring patterns on a price chart. These price patterns often offer insight into historical price movements and can be used to analyze the future trajectory of a cryptocurrency.
Titan of Crypto revealed that the Ethereum price is currently at the same spot that the price of BTC was in August 2020. At the time, the premier cryptocurrency was trading within a converging wedge pattern before breaking out to its then all-time-high price at around $69,000.
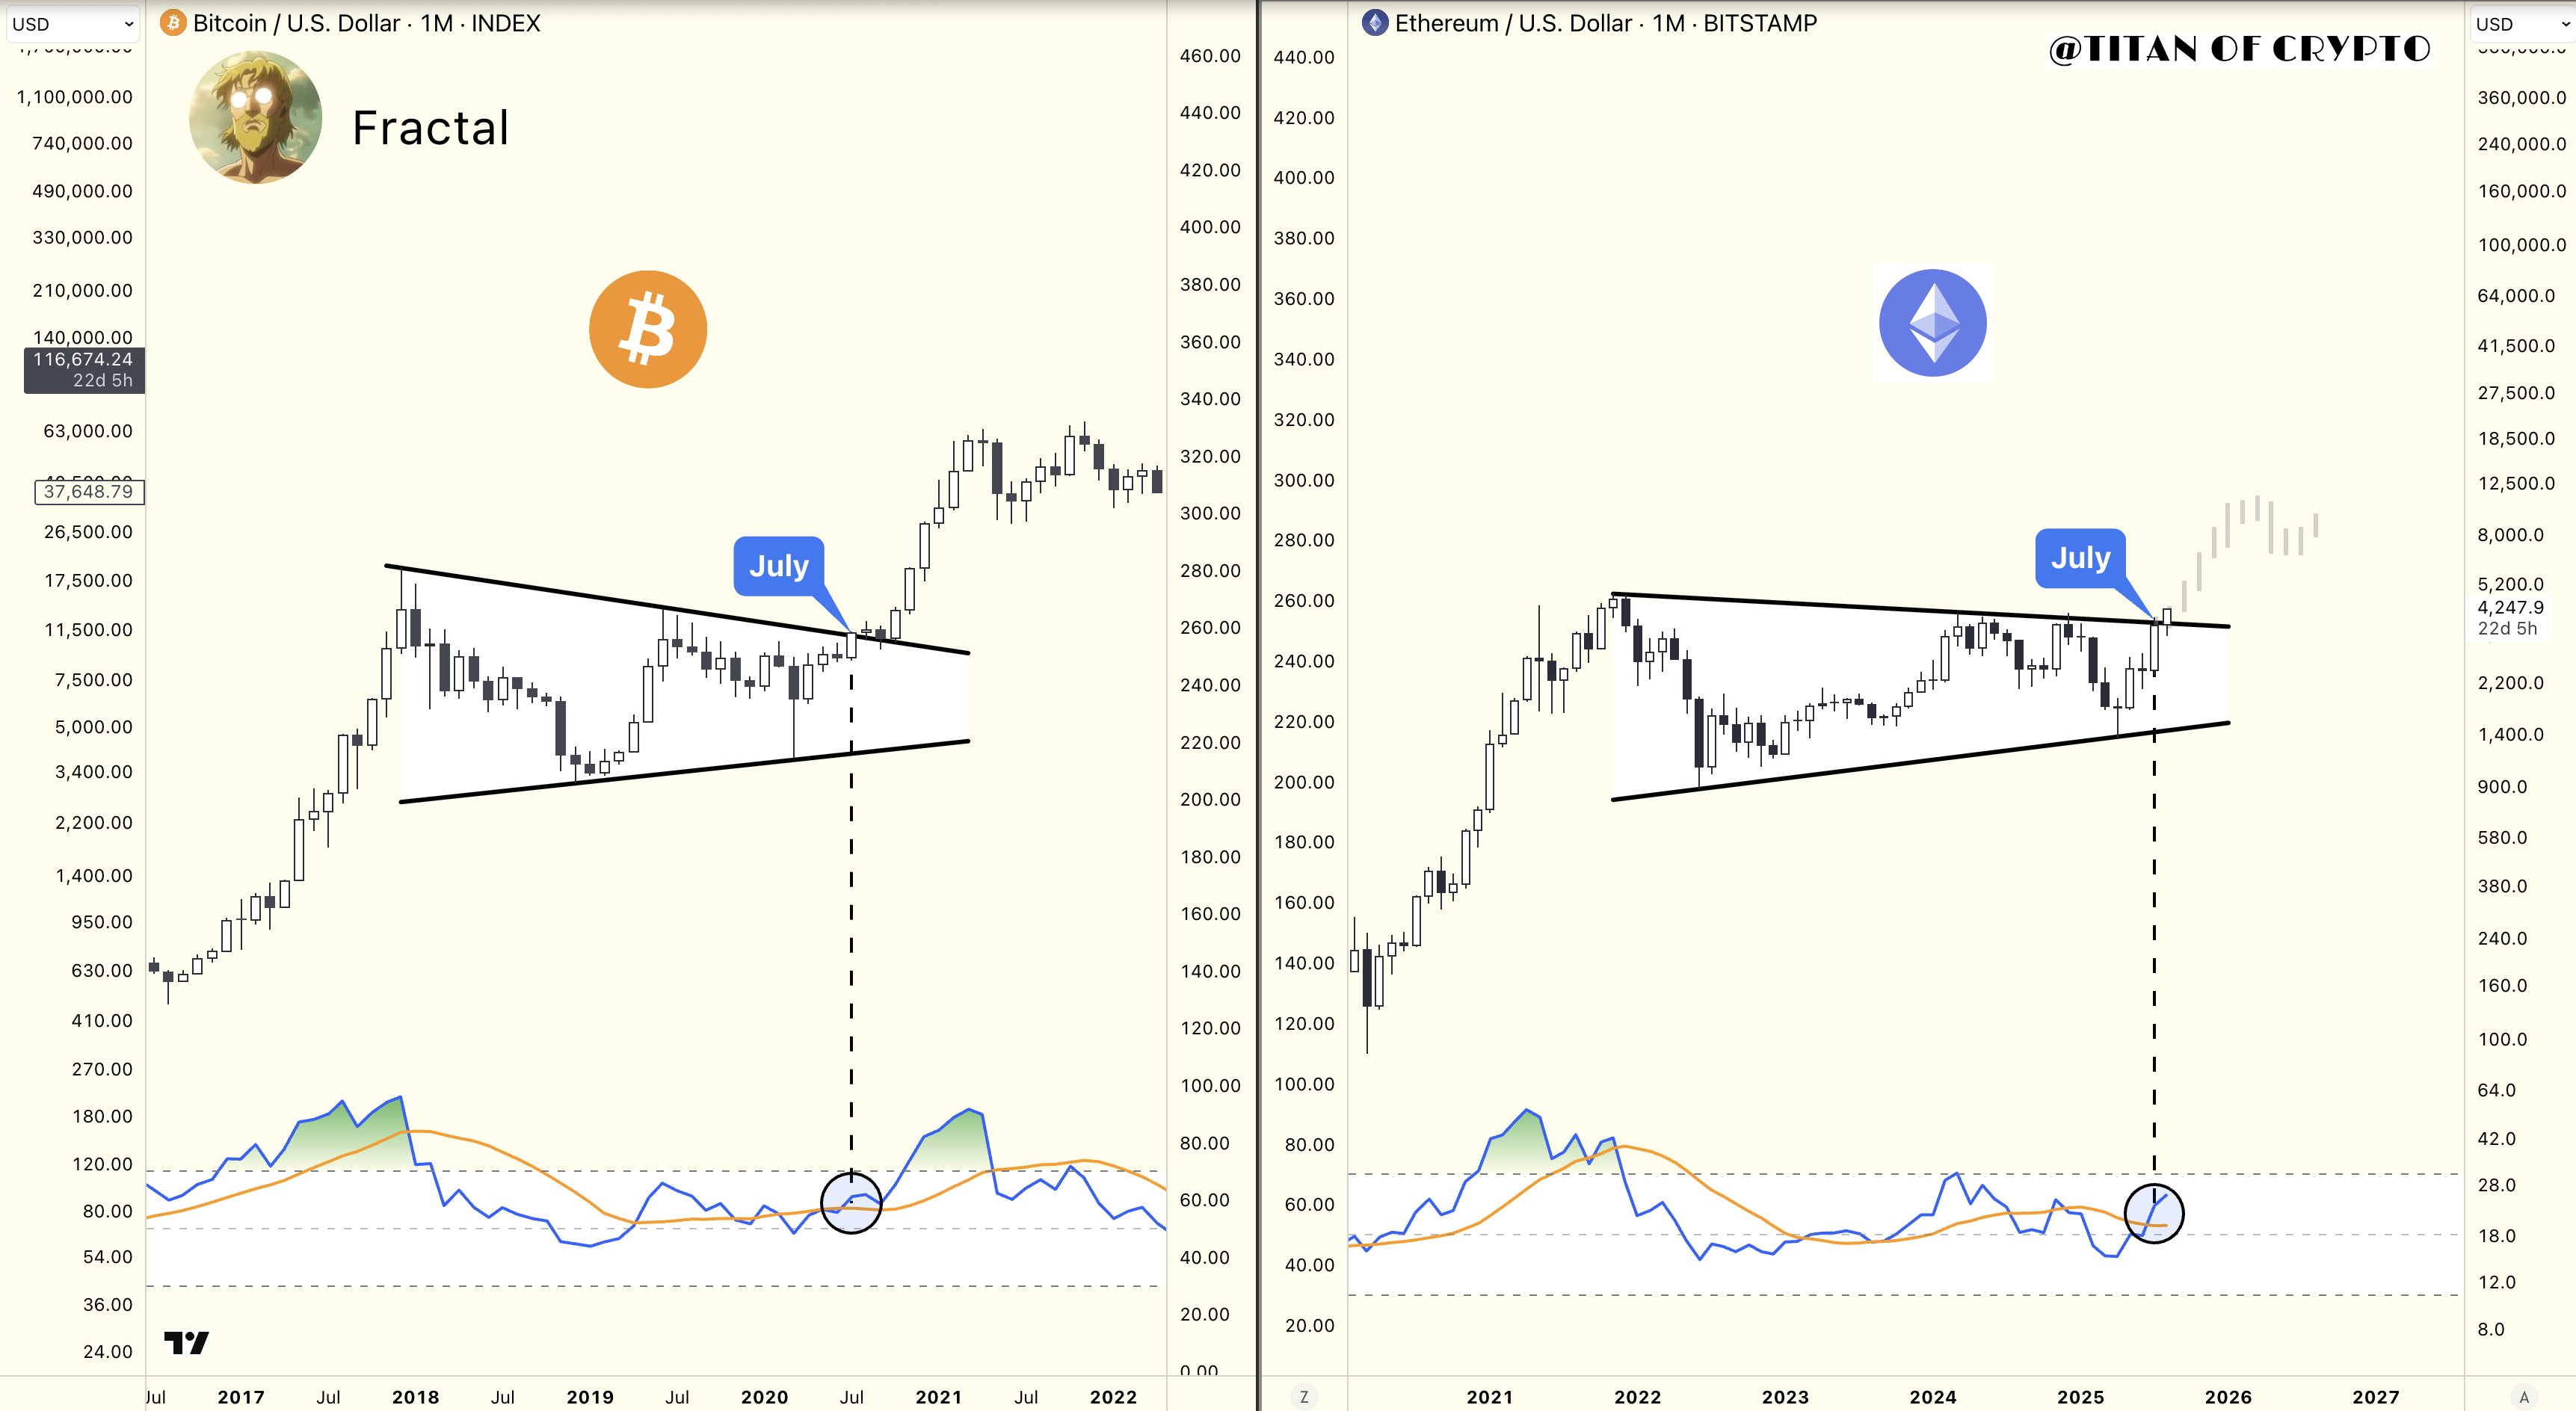
As shown in the chart above, the Ethereum price is currently trading within a similar converging wedge pattern on the monthly chart. Both BTC and ETH prices recently bounced off the lower boundary of the chart pattern earlier in 2020 and 2025, respectively.
Almost identically, the two largest cryptocurrencies almost broke above the trendline with their respective July 2020 and 2025 candlestick. While the price of BTC hovered around the upper trendline in the subsequent two months, the Ethereum price has broken clearly above the wedge pattern with its August candlestick.
If history is anything to go by, and a sustained monthly close above $4,000 occurs, the price of Ethereum could be on its way to an unprecedented high around the $12,000 region. This MOVE represents a potential 182% surge for ETH from its current price point.
Ethereum Price At A Glance
As of this writing, the Ethereum token is valued at around $4,270, reflecting an almost 6% increase in the past 24 hours. According to data from CoinGecko, the altcoin is up by more than 25% in the past seven days.
