Bitcoin Awakens with a Vengeance – $120K Target Now in Sight

Bitcoin shakes off its slumber like a caffeinated bull—liquidity hunters are circling as the $120K threshold glows on trading screens.
Why the sudden surge? Institutional FOMO meets a supply crunch. Grayscale’s ETF inflows hit record highs while miners hoard coins like dragons guarding gold. Meanwhile, Wall Street analysts scramble to revise price targets upward—again.
Technical breakout or trap? The monthly chart shows a clean breach of the 2024 ATH, but skeptics whisper about leveraged longs piling in. 'Classic bull market behavior,' quips a hedge fund manager, adjusting his Lamborghini lease terms.
One thing’s certain: Bitcoin thrives on volatility. Whether it’s a sprint to six figures or a brutal retracement first, traders are strapped in for the ride. And as always, the only free lunch in crypto? The bankers’ tears when they miss the boat—again.
Bitcoin Price Aims Higher
Bitcoin price found support NEAR the $112,200 zone and started a fresh increase. BTC was able to climb above the $113,500 and $114,800 resistance levels.
The price even cleared the $115,500 resistance to move into a positive zone. Finally, the price tested the $117,500 resistance zone. A high was formed at $117,643 and the price is now consolidating gains above the 23.6% Fib retracement level of the upward move from the $112,629 swing low to the $116,643 high.
Bitcoin is now trading above $115,000 and the 100 hourly Simple moving average. There is also a key bullish trend line forming with support at $115,600 on the hourly chart of the BTC/USD pair.
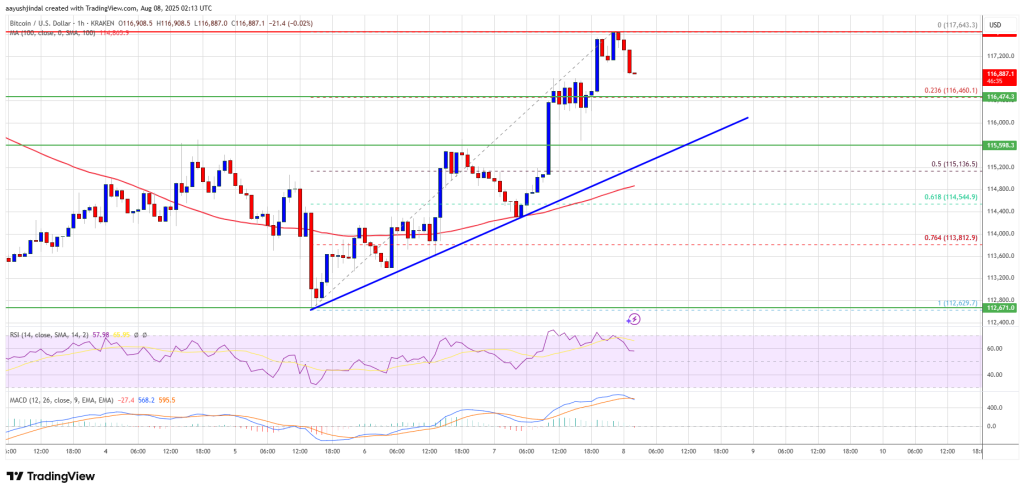
Immediate resistance on the upside is near the $117,200 level. The first key resistance is near the $117,500 level. The next resistance could be $118,250. A close above the $118,250 resistance might send the price further higher. In the stated case, the price could rise and test the $119,200 resistance level. Any more gains might send the price toward the $120,000 level. The main target could be $121,500.
Another Drop In BTC?
If Bitcoin fails to rise above the $117,500 resistance zone, it could start another decline. Immediate support is near the $116,450 level. The first major support is near the $115,600 level and the trend line.
The next support is now near the $114,550 zone or the 61.8% Fib retracement level of the upward move from the $112,629 swing low to the $116,643 high. Any more losses might send the price toward the $113,800 support in the near term. The main support sits at $112,500, below which BTC might continue to move down.
Technical indicators:
Hourly MACD – The MACD is now losing pace in the bullish zone.
Hourly RSI (Relative Strength Index) – The RSI for BTC/USD is now above the 50 level.
Major Support Levels – $115,600, followed by $114,550.
Major Resistance Levels – $117,500 and $118,250.
