Avalanche’s Double Bottom Signals Reversal – Can It Smash Through the Next Fib Resistance?

Avalanche (AVAX) traders are eyeing a potential trend reversal as the cryptocurrency forms a bullish double bottom pattern. The setup suggests accumulating momentum—but can it punch through the next Fibonacci resistance zone?
Technical traders are leaning into the charts, watching for confirmation of an uptrend. If history rhymes, this could be the start of a significant move.
Of course, in crypto, even the most promising patterns sometimes fizzle out faster than a hedge fund's 'long-term vision.' Proceed with cautious optimism—and maybe keep a finger near the sell button.
Double Bottom Strengthens: Can Fibonacci Levels Hold?
In a recent analysis of the weekly chart posted on X, The Boss, a market analyst, highlighted that Avalanche is currently establishing a solid technical foundation. He noted the emergence of a clear double bottom formation, often considered a reliable reversal signal when confirmed.
According to The Boss, if this bullish pattern continues to play out, traders should keep an eye on the resistance zones marked by yellow lines, which are based on Fibonacci retracement levels.
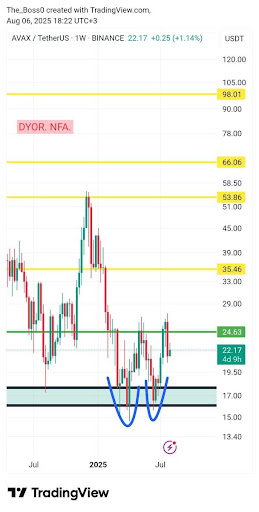
The Boss emphasized that the most critical level to watch is the horizontal resistance represented by the green line. He explained that a strong weekly close above this area WOULD likely act as a technical catalyst, potentially unlocking more upside for AVAX in the near term
Charting Key Technical Indicators
Sharing further technical breakdown, The Boss drew attention to several key indicators that signal growing bullish momentum for AVAX. One of the standout observations is the MACD on the weekly chart, which is on the verge of a bullish crossover—a classic signal that buying pressure is gaining strength.
The Boss also noted that the Relative Strength Index (RSI) is hovering around 55, just above the midpoint of the neutral zone. This positioning, coupled with its upward tilt, reflects a shift in momentum that favors the bulls. If the key indicator continues this upward trajectory, it could reinforce the developing bullish sentiment.
Turning to the ADX, The Boss explained that while it remains below the 25 threshold—typically used to define a strong trend—it is showing gradual signs of strengthening. He suggested that a MOVE above 25 would add weight to the bullish case by confirming the emergence of a more defined upward trend.
Volume was another factor that The Boss highlighted in his analysis. He pointed out a steady increase in trading volume over recent weeks, which often signifies growing investor interest and confidence. In his view, this uptick supports the technical outlook and adds fuel to the potential breakout scenario.
However, The Boss issued a note of caution despite the promising setup. He emphasized that crypto markets are inherently volatile, and for this bullish case to hold, price action must remain above key resistance zones. Traders, he advised, should watch closely for confirmation from indicators and weekly closes to validate the continuation of the trend.
