Bitcoin at a Crossroads: Heat Macro Phase Reveals Critical Tug-of-War Between Accumulation and Distribution

Bitcoin's market cycle is flashing mixed signals—and traders are sweating bullets. The Heat Macro Phase indicator suggests we're stuck in no-man's-land between whales loading up and dumping bags. Here's what it means for your portfolio.
The Accumulation Whisperers
On-chain data shows pockets of smart money quietly stacking sats. But don't break out the champagne yet—this isn't 2021's mindless FOMO.
Distribution Tensions Rising
Meanwhile, exchange inflows hint at growing sell pressure. Somebody's getting ready to take profits... and it's probably the same insiders who 'called the top' last cycle.
The Verdict: Proceed With Caution
This isn't your typical bull market pullback. We're seeing a fundamental battle between diamond hands and weak knees—with Bitcoin's next major move hanging in the balance. (And yes, your favorite crypto influencer definitely doesn't know which way it'll break.)
Bitcoin Heat Macro Phase Signals Neutral Market
Top analyst Axel Adler recently shared insights into the Bitcoin Heat Macro Phase—a metric that condenses several key market indicators into a single scalar value, offering a simplified yet powerful view of where Bitcoin stands in its broader macro cycle. The metric combines data points such as overvaluation assessments, profit-taking activity, long-term holder (LTH) selling pressure, and ETF inflows to gauge whether the market is overheated or entering a favorable accumulation zone.
When the Heat Macro Phase reaches high values NEAR 50%, it typically signals that these components are at their upper historical bounds—suggesting an overheated market that may be nearing a distribution phase or a correction. Conversely, readings closer to 30% reflect cooler market conditions: lower profit-taking, modest ETF activity, and minimal LTH selling. These scenarios often indicate that the market is undervalued and ripe for accumulation.
Currently, the Bitcoin Heat Macro Phase sits at 44%, putting it squarely in the neutral zone. Adler explains that this level reflects a balanced market environment—neither overbought nor undervalued. There’s no clear dominance by bulls or bears. Profit-taking is beginning to accelerate, but it hasn’t reached a level that WOULD suggest a broader exit is underway.
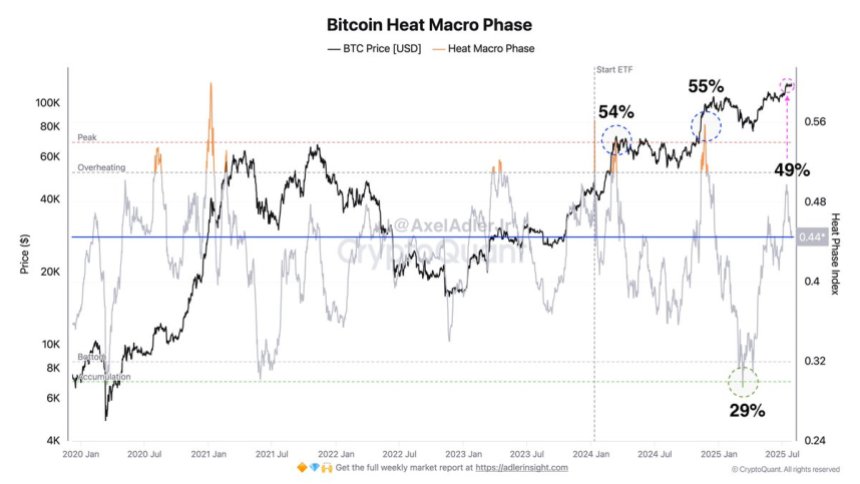
This mid-range reading aligns with Bitcoin’s recent price action, which has remained in a tight consolidation for over two weeks. As the metric hovers in neutral territory, it reinforces the idea that the next significant move—whether upward toward new highs or downward in a correction—will depend entirely on upcoming price behavior. For now, the Bitcoin Heat Macro Phase acts as a market barometer, signaling patience as investors wait for the next breakout or breakdown to confirm direction.
BTC Price Action Details: Tight Consolidation
Bitcoin continues to consolidate between well-defined support and resistance levels, currently trading at $118,269.81 on the 12-hour chart. The price action has remained confined within a horizontal range, with upper resistance at $122,077 and strong support at $115,724. This range has persisted for over two weeks, reflecting a phase of indecision where neither bulls nor bears have asserted dominance.
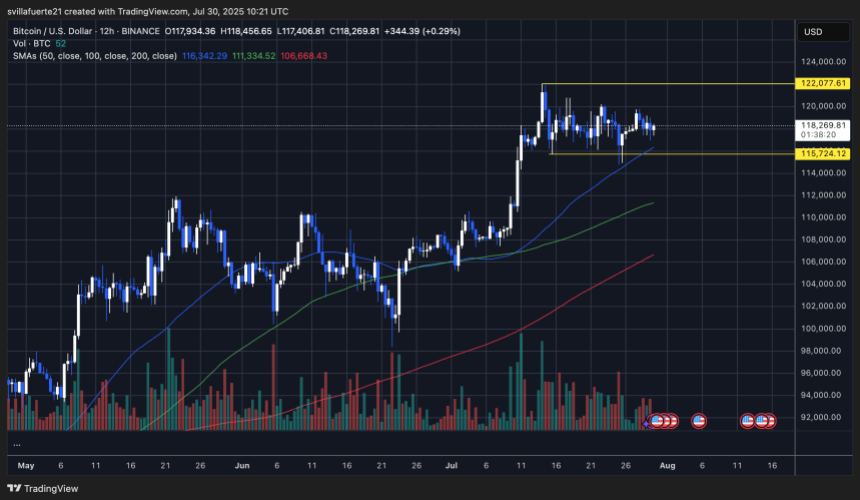
The 50, 100, and 200 SMAs—located at $116,342, $111,334, and $106,668, respectively—are all trending upward, suggesting that the broader structure remains bullish. BTC is currently trading above all key moving averages, which are acting as dynamic support. However, volume has decreased significantly, indicating a lack of conviction from both sides of the market.
The tightening structure suggests that a breakout is approaching. If buyers manage to push BTC above $122K with strong volume, the next leg higher toward new all-time highs could follow. On the other hand, a breakdown below $115K would invalidate the current setup and open the door to a deeper correction.
Featured image from Dall-E, chart from TradingView
