BNB Price Pulls Back After Stellar Rally – Time to Buy the Dip or Brace for More Pain?

BNB's red-hot streak hits a speed bump as traders take profits. The crypto darling soared to dizzying heights last week—now facing a classic 'buy the rumor, sell the news' moment.
### Correction or Carnage?
Every bull run needs breathers. This 10% dip from local highs looks textbook so far—no panic selling, just futures liquidations cleaning up leverage junkies. Binance's native token still holds key support levels... for now.
### Whale Watching Season
On-chain data shows mega-holders quietly accumulating during this pullback. Retail FOMO might be cooling, but smart money sees value at these levels. Then again, 'smart money' also brought us Terra Luna.
### The Cynic's Take
Another day, another crypto 'healthy correction' that could turn into a 50% bloodbath by tomorrow. At least the volatility makes traditional forex look like watching paint dry.
BNB Price Trims Some Gains
After a steady increase, BNB price failed to clear the $860 zone. There was a downside correction below the $850 and $680 levels, like Ethereum and Bitcoin.
The price even dipped below $840 and tested $800. There was a clear MOVE below the 23.6% Fib retracement level of the upward move from the $744 swing low to the $861 high. The bulls are now active near the $800 support zone.
There is also a key bullish trend line forming with support at $800 on the hourly chart of the BNB/USD pair. The price is now trading below $810 and the 100-hourly simple moving average.
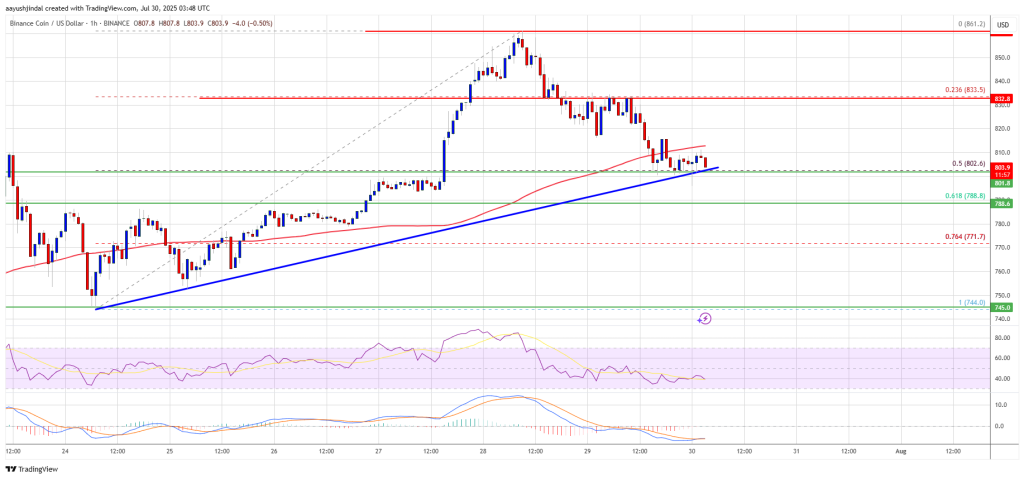
On the upside, the price could face resistance near the $810 level. The next resistance sits near the $820 level. A clear move above the $820 zone could send the price higher. In the stated case, BNB price could test $845. A close above the $845 resistance might set the pace for a larger move toward the $860 resistance. Any more gains might call for a test of the $880 level in the near term.
More Losses?
If BNB fails to clear the $820 resistance, it could start another decline. Initial support on the downside is near the $800 level. The next major support is near the $788 level.
The main support sits at $770. If there is a downside break below the $770 support, the price could drop toward the $750 support. Any more losses could initiate a larger decline toward the $735 level.
Technical Indicators
Hourly MACD – The MACD for BNB/USD is gaining pace in the bearish zone.
Hourly RSI (Relative Strength Index) – The RSI for BNB/USD is currently below the 50 level.
Major Support Levels – $800 and $788.
Major Resistance Levels – $810 and $820.
