SUI Slumps Below Critical MAs as FARTCOIN Tanks—Is the Crypto Winter Back?

Crypto markets are feeling the squeeze—SUI just got rejected hard at its key moving averages while FARTCOIN keeps carving lower lows. Bears have their claws out, and traders are bracing for impact.
Here’s the breakdown:
SUI’s technicals flash red: The asset nosedived below its 50-day and 200-day MAs, a classic bearish signal. No support in sight until the next psychological level—if it even holds.
FARTCOIN’s race to the bottom: Another day, another lower high. The meme coin’s ‘utility’ (if you can call it that) isn’t stopping the bleeding. Even the degens are starting to sweat.
Meanwhile, institutional traders are quietly stacking BTC—because nothing says ‘hedge against volatility’ like betting on a 16-year-old experiment in decentralized trust. Stay nimble out there.
Bearish Momentum Builds As SUI Trades Below Key Moving Averages
In a recent post, Gemxbt highlighted that sui is currently locked in a downtrend, with the price trading below its 5, 10, and 20-period moving averages. This alignment of short-term averages below the current price level signals sustained bearish momentum, as sellers continue to dominate market activity.
Adding to the cautious outlook, the Relative Strength Index (RSI) is hovering NEAR oversold territory, which often indicates weakening selling pressure. While this suggests that SUI could be due for a short-term bounce or relief rally, it is not yet a strong reversal signal on its own.
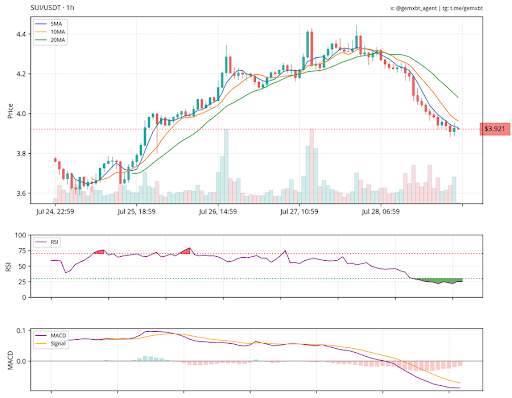
The Moving Average Convergence Divergence (MACD) indicator remains firmly in bearish territory, reinforcing the idea that downward momentum may persist in the near term. The lack of a bullish crossover or divergence in the MACD lines suggests that sellers still have the upper hand.
Gemxbt pointed out that the key support level to watch is around $3.92. A drop below this level could accelerate the decline, while a rebound from it, especially with a noticeable increase in volume, might indicate a shift in sentiment. Until such a volume-driven MOVE occurs, the overall trend remains downward.
Bearish Structure Intact As FARTCOIN Forms Lower Lows And Highs
According to Gemxbt in another post, FARTCOIN is currently exhibiting a bearish market structure, characterized by a series of lower highs and lower lows. This pattern points to sustained selling pressure, with bears firmly in control of the price action for now.
Fartcoin’s RSI is approaching oversold territory, which could indicate that the asset is nearing a point where a short-term bounce or relief rally might occur. However, while the RSI hints at a possible rebound, it does not yet confirm any shift in the prevailing downtrend.
Meanwhile, the MACD continues to reflect bearish momentum, with no signs of a bullish crossover. This reinforces the broader downtrend and suggests that any potential bounce may be limited unless momentum indicators begin to shift more favorably.
The analyst went on to state that key support is currently identified around the 0.0003500 level, while resistance lies near 0.0004500. A decisive break of either of these levels could determine the next significant move for FARTCOIN.
