Bitcoin Weathers One of the Most Brutal Bear Weeks in This Bull Cycle – What You Need to Know

Bitcoin just got sucker-punched—hard. The king of crypto bled out during one of the most savage bear weeks of this bull run. Here’s the breakdown.
### The Carnage in Charts
No sugarcoating it: BTC got mauled. The charts look like a skydiver without a parachute—sharp drops, panic selling, and that eerie silence before the next move.
### Why This Hurts More
This wasn’t just another dip. Liquidation cascades turned into a full-blown fire sale. Even the diamond hands questioned their life choices.
### The Silver Lining (Because There Always Is)
Remember—Bitcoin’s died a hundred times before. And just like Wall Street’s latest 'sure thing,' it keeps bouncing back. Funny how that works.
Bitcoin Holds Strong Amid Heavy Selling
Adler highlighted that this week ranks among the top 7% of the most extreme in terms of selling volume during the current bitcoin bull cycle. Despite the intense selling pressure, Bitcoin has shown notable resilience, recovering to $117,000 by week’s end. This rebound is seen as a positive signal, reflecting bullish strength in the face of aggressive distribution.
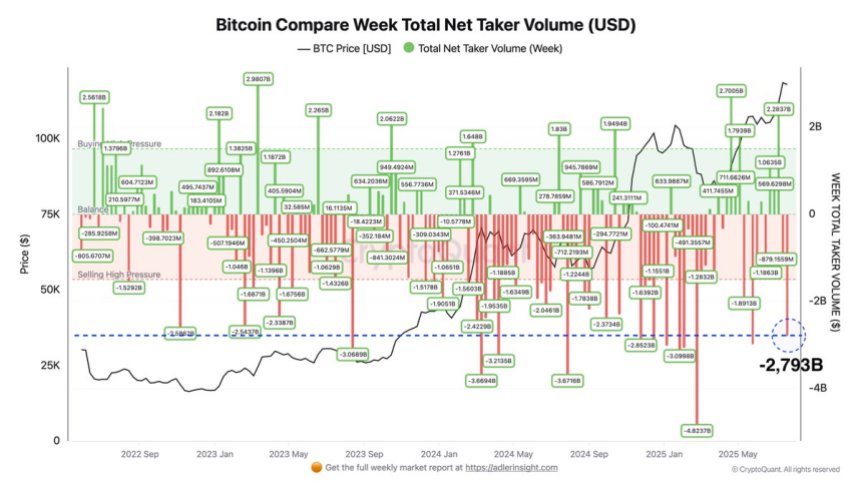
While Bitcoin remains in a tight consolidation range, its dominance is starting to weaken relative to ethereum and other major altcoins. This shift has caught the attention of analysts who now view this week as a pivotal moment. A continued decrease in Bitcoin dominance paired with growing strength in altcoins could mark the beginning of the long-anticipated altseason—a period where capital rotates from Bitcoin into alternative cryptocurrencies, driving strong gains across the sector.
Still, Bitcoin’s recent recovery and consolidation above key support suggest that its bullish momentum may not be over. If buyers continue to defend the current range, BTC could be gearing up for another leg higher, putting pressure on shorts and reigniting market confidence.
BTC Retests Resistance After Strong Recovery
Bitcoin (BTC) is currently trading around $117,867 on the 4-hour chart after recovering sharply from the $115,724 support level. This area has proven to be a critical short-term demand zone, with bulls stepping in aggressively to defend it following a recent dip. The price is now pressing against the 100-period SMA ($117,822), attempting to reclaim this level as support.
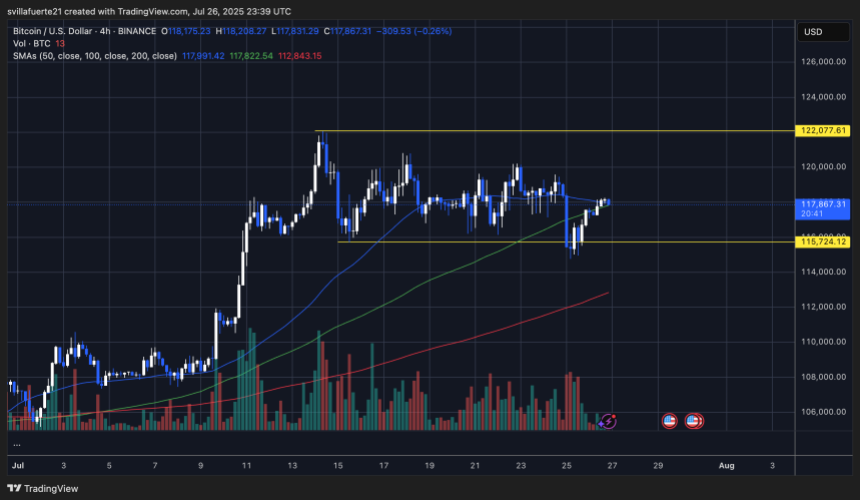
The structure of the chart shows BTC remains locked in a well-defined consolidation range between $115,724 and $122,077. This week’s retest of the lower boundary and subsequent bounce signals continued interest from buyers, despite strong selling pressure earlier in the week. Volume remains elevated, suggesting active market participation during the recent recovery.
The key to watch now is whether BTC can flip the 100 SMA and hold above $118,000. If confirmed, the next major test will be the upper range resistance at $122,077. A clean breakout above this level could set the stage for new all-time highs.
Featured image from Dall-E, chart from TradingView
