🚀 Solana (SOL) Blasts Past $200—Next Stop $220–$250 as Bulls Charge

Solana’s SOL isn’t just climbing—it’s mooning. The asset smashed through $200 like a hot knife through institutional FUD, and now traders are eyeing the $220–$250 zone as the next profit frontier.
### The breakout no one saw coming (except everyone on Crypto Twitter)
SOL’s rally defies the usual ‘buy the rumor, sell the news’ circus. No hype, no meme-fueled pump—just relentless upward momentum that’s leaving skeptics scrambling.
### Targets locked: Where the smart money’s aiming
$220 is now the floor. With RSI looking less ‘overbought’ and more ‘overachiever,’ analysts whisper about a potential 25% surge if Bitcoin doesn’t pull its usual ‘correction’ nonsense.
### The cynical footnote
Meanwhile, Wall Street still thinks ‘blockchain’ is a type of ergonomic chair. Their loss—your gain.
Solana Price Gains Momentum
Solana price started a decent increase after it cleared the $180 resistance, like Bitcoin and Ethereum. SOL climbed above the $185 level to enter a short-term positive zone.
The price even smashed the $200 resistance. A high was formed at $207 and the price is now correcting gains. There was a MOVE below the $205 level and toward the 23.6% Fib retracement level of the upward move from the $178 swing low to the $207 high.
Solana is now trading above $195 and the 100-hourly simple moving average. There is also a key bullish trend line forming with support at $199 on the hourly chart of the SOL/USD pair.
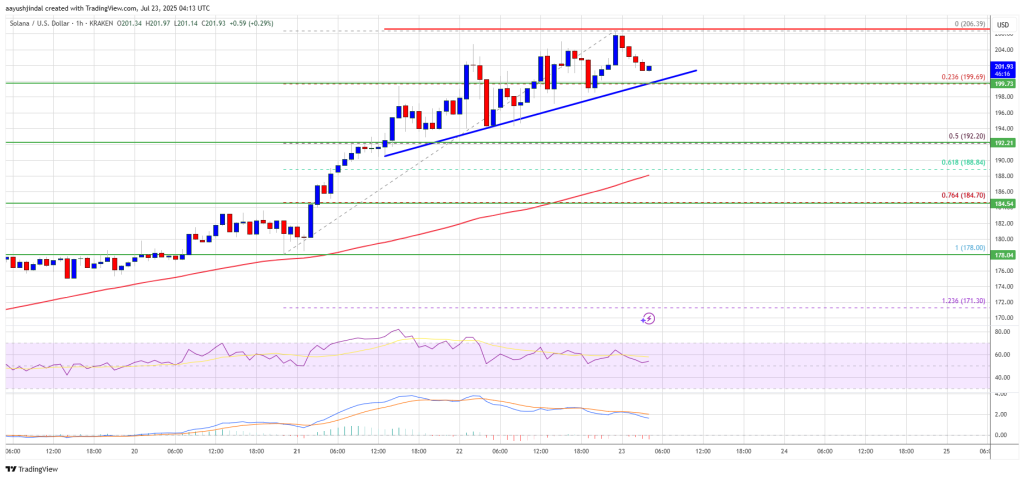
On the upside, the price is facing resistance NEAR the $205 level. The next major resistance is near the $208 level. The main resistance could be $215. A successful close above the $215 resistance zone could set the pace for another steady increase. The next key resistance is $232. Any more gains might send the price toward the $245 level.
Are Downsides Limited In SOL?
If SOL fails to rise above the $208 resistance, it could start another decline. Initial support on the downside is near the $199 zone and the trend line. The first major support is near the $195 level.
A break below the $195 level might send the price toward the $192 support zone or the 50% Fib retracement level of the upward move from the $178 swing low to the $207 high. If there is a close below the $192 support, the price could decline toward the $185 support in the near term.
Technical Indicators
Hourly MACD – The MACD for SOL/USD is losing pace in the bullish zone.
Hourly Hours RSI (Relative Strength Index) – The RSI for SOL/USD is above the 50 level.
Major Support Levels – $199 and $192.
Major Resistance Levels – $208 and $215.

Log in to Reply
Log in to comment your thoughtsComments
Related Articles
|Square
Get the BTCC app to start your crypto journey
Get started today Scan to join our 100M+ users