Bitcoin Primed for Another Rally—Will Bulls Finally Break Through?

Bitcoin's price action is tightening like a coiled spring—and the bulls are hungry for a breakout.
After weeks of consolidation, BTC shows textbook accumulation patterns. Whales scooping up dips? Check. Retail FOMO simmering? Check. Now it's all about momentum.
The make-or-break level: $68K. Clear that, and we're off to the races toward new ATHs. Fail? Cue the 'overleveraged crypto bros' memes.
Meanwhile, Wall Street's still trying to 'explain blockchain' with PowerPoint slides from 2017. Some things never change.
Bitcoin Price Aims Higher
Bitcoin price started a correction phase below the $118,500 support zone. BTC dipped below the $118,000 level and tested the $116,200 zone.
A low was formed at $116,260 and the price started another increase. There was a decent MOVE above the $118,000 and $118,500 levels. Besides, there was a break above a bearish trend line with resistance at $118,000 on the hourly chart of the BTC/USD pair.
However, the pair struggled to surpass the $120,000 resistance zone. A high was formed near $120,237 and the price is now consolidating gains near the 23.6% Fib retracement level of the upward move from the $116,260 swing low to the $120,237 high.
Bitcoin is now trading above $118,500 and the 100 hourly Simple moving average. Immediate resistance on the upside is near the $119,800 level. The first key resistance is near the $120,200 level.
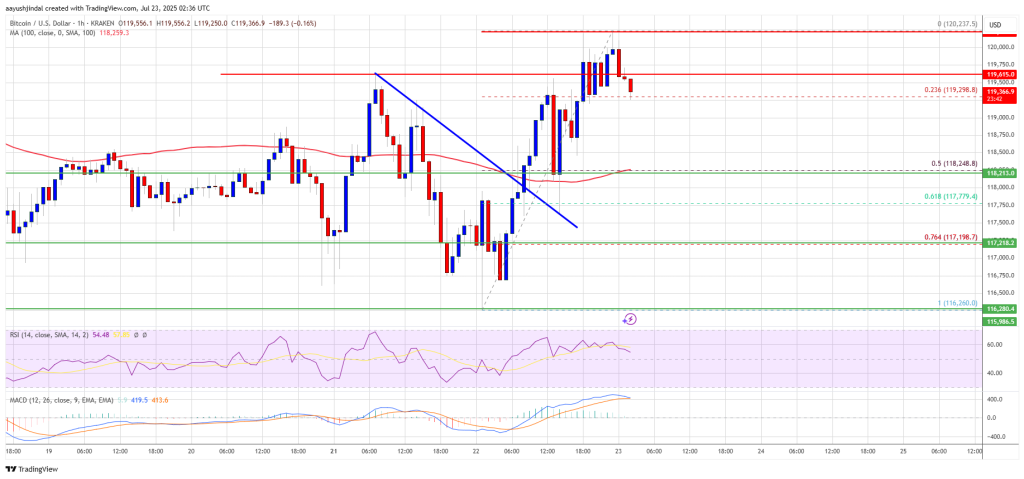
The next resistance could be $121,000. A close above the $121,000 resistance might send the price further higher. In the stated case, the price could rise and test the $122,500 resistance level. Any more gains might send the price toward the $122,500 level. The main target could be $123,200.
Another Drop In BTC?
If Bitcoin fails to rise above the $120,200 resistance zone, it could start another decline. Immediate support is near the $119,200 level. The first major support is near the $118,500 level.
The next support is now near the $118,200 zone. Any more losses might send the price toward the $116,500 support in the near term. The main support sits at $115,000, below which BTC might continue to move down.
Technical indicators:
Hourly MACD – The MACD is now losing pace in the bullish zone.
Hourly RSI (Relative Strength Index) – The RSI for BTC/USD is now above the 50 level.
Major Support Levels – $119,200, followed by $118,500.
Major Resistance Levels – $120,200 and $121,000.

Log in to Reply
Log in to comment your thoughtsComments
Related Articles
|Square
Get the BTCC app to start your crypto journey
Get started today Scan to join our 100M+ users