BNB Price Stalls as Altcoins Surge: Is the Binance Token Losing Its Edge?

BNB hits a wall while rival tokens rally—market watchers question if Binance's flagship asset is running out of gas.
The Great Altcoin Escape
As Ethereum killers and meme coins post double-digit gains, BNB's sideways action sticks out like a banker at a crypto rave. The token's failure to capitalize on the risk-on sentiment raises eyebrows—especially with Binance's regulatory battles still fresh in traders' minds.
Liquidity or Liability?
Market depth charts show thinning order books around key support levels. Meanwhile, perpetual swap funding rates suggest leveraged traders are losing patience. 'It's becoming a utility token that forgot to be useful,' quips one hedge fund manager between sips of overpriced artisanal coffee.
The Institutional Angle
While retail chases shiny new DeFi projects, institutional flows tell a different story. BNB's 30-day correlation with Bitcoin has tightened to 0.78—proof that when the big players get nervous, they still treat the Binance token as a proxy for crypto's reserve currency.
The irony? BNB's stagnation comes just as its exchange burns another $500 million worth of tokens. Nothing says 'bullish' like artificial scarcity—except maybe actual demand.
BNB Price Faces Hurdles
After a steady increase, BNB price failed to clear the $710 zone. There was a downside correction below the $690 and $680 levels, unlike Ethereum and Bitcoin.
The price even dipped below $678 and tested $675. A low was formed at $674 and the price is now attempting to recover. There was a MOVE above $680. The price climbed above the 50% Fib retracement level of the downward move from the $707 swing high to the $674 low.
However, the bears are active near $692. There is also a key bearish trend line forming with resistance at $692 on the hourly chart of the BNB/USD pair. The price is now trading below $690 and the 100-hourly simple moving average.
On the upside, the price could face resistance near the $692 level. The next resistance sits near the $695 level or the 61.8% Fib retracement level of the downward move from the $707 swing high to the $674 low.
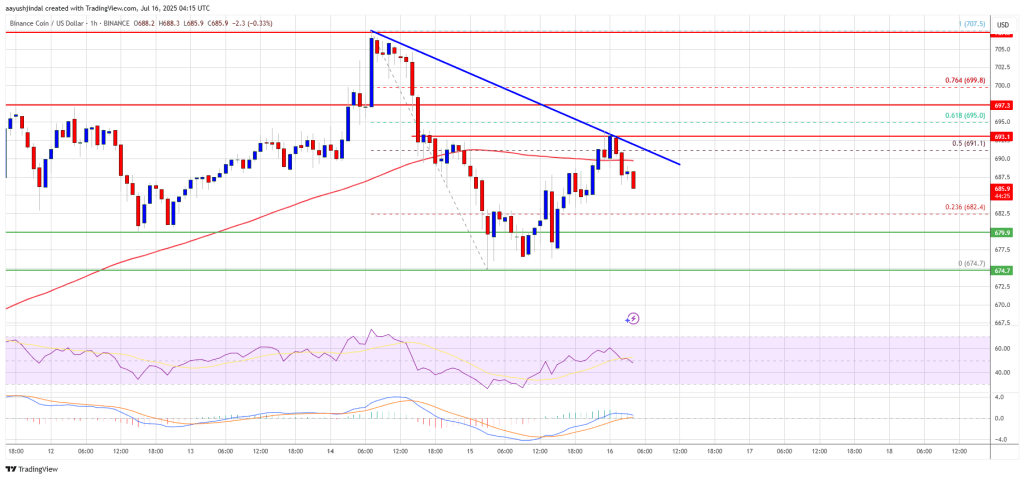
A clear move above the $695 zone could send the price higher. In the stated case, BNB price could test $708. A close above the $708 resistance might set the pace for a larger move toward the $720 resistance. Any more gains might call for a test of the $732 level in the near term.
Another Decline?
If BNB fails to clear the $692 resistance, it could start another decline. Initial support on the downside is near the $682 level. The next major support is near the $680 level.
The main support sits at $674. If there is a downside break below the $674 support, the price could drop toward the $665 support. Any more losses could initiate a larger decline toward the $650 level.
Technical Indicators
Hourly MACD – The MACD for BNB/USD is losing pace in the bullish zone.
Hourly RSI (Relative Strength Index) – The RSI for BNB/USD is currently below the 50 level.
Major Support Levels – $685 and $680.
Major Resistance Levels – $692 and $708.
