Bitcoin’s Dip: Last Chance to Buy Before the Rocket or Run for Cover?

Bitcoin plays its favorite game—keep traders guessing. After a 12% pullback this week, the crypto king sits at $58,300, testing the nerves of bulls and bears alike.
Is this the dip before the rip?
Historically, July corrections precede Q3 rallies—just ask the 2020 and 2023 hodlers who saw 200%+ runs. But with institutional whales quietly accumulating (Coinbase premiums suggest $600M+ in stealth buys), retail FOMO could ignite any second.
Or is it doom o’clock?
Macro headwinds are real. The Fed’s reverse repo drain hit $2T this month—liquidity vampires coming for risk assets. And let’s be honest—Wall Street still treats crypto like a Vegas side bet while quietly front-running your moves.
One truth remains: volatility is the price of admission. Whether this is the calm before the surge or the storm depends entirely on your time horizon—and how much you trust the ‘institutions are coming’ narrative they’ve been selling since 2017.
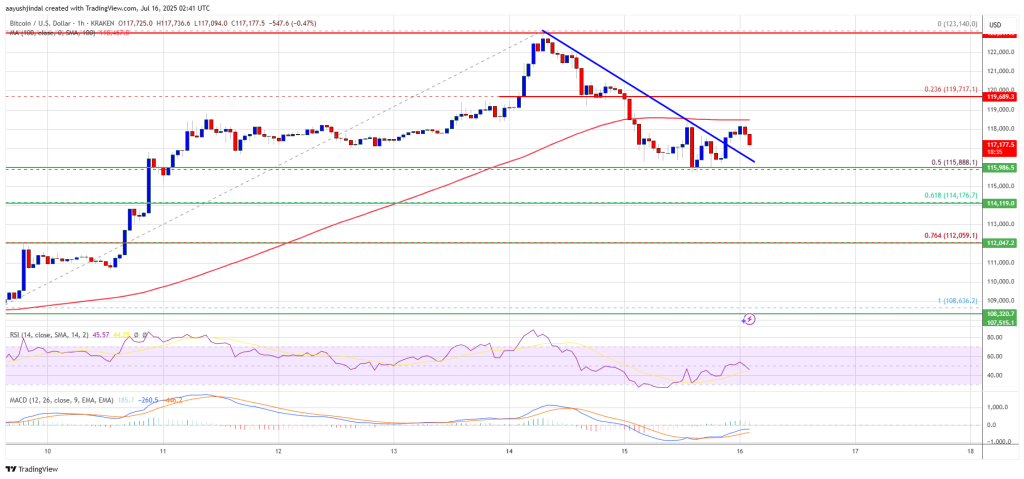
Bitcoin Price Corrects From New ATH
Bitcoin price started a fresh increase after it cleared the $118,500 resistance zone. BTC gained pace for a MOVE above the $120,000 and $122,000 resistance.
The bulls even pumped the pair above the $123,000 zone. A new all-time high was formed at $123,140 and the price is now correcting gains. There was a move below the 23.6% Fib retracement level of the upward move from the $108,636 swing low to the $123,140 high.
Bitcoin is now trading below $120,500 and the 100 hourly Simple moving average. However, the price is holding the 50% Fib level of the upward move from the $108,636 swing low to the $123,140 high.
Besides, there was a break above a bearish trend line with resistance at $117,300 on the hourly chart of the BTC/USD pair. Immediate resistance on the upside is near the $118,500 level. The first key resistance is near the $120,000 level. The next resistance could be $122,000.
A close above the $122,000 resistance might send the price further higher. In the stated case, the price could rise and test the $123,200 resistance level. Any more gains might send the price toward the $125,000 level. The main target could be $130,000.
More Losses In BTC?
If Bitcoin fails to rise above the $120,000 resistance zone, it could continue to move down. Immediate support is near the $115,850 level. The first major support is near the $115,500 level.
The next support is now near the $114,150 zone. Any more losses might send the price toward the $112,500 support in the near term. The main support sits at $110,500, below which BTC might continue to move down.
Technical indicators:
Hourly MACD – The MACD is now losing pace in the bearish zone.
Hourly RSI (Relative Strength Index) – The RSI for BTC/USD is now below the 50 level.
Major Support Levels – $115,500, followed by $114,150.
Major Resistance Levels – $120,000 and $122,000.

Log in to Reply
Log in to comment your thoughtsComments
Related Articles
|Square
Get the BTCC app to start your crypto journey
Get started today Scan to join our 100M+ users