Solana (SOL) Tests Key Support: Will the $155 Level Hold Amid Market Pullback?

Solana bulls face a critical test as SOL retreats toward its $155 support level. The Ethereum killer's recent rally hit turbulence—now traders are watching to see if this is a healthy dip or the start of something uglier.
The make-or-break zone
That $155 line isn't just psychological—it's where institutional buy orders clustered last quarter. Lose this foothold, and suddenly those 'Solana summer' memes start looking frostbitten.
Volume tells the tale
Thin order books could turn this retracement into a rout if sellers overwhelm the bids. But stack enough limit orders at $155, and SOL might just bounce like it's got a Layer 1 to prove.
Either way, grab popcorn—watching crypto traders rationalize their bag-holding as 'strategic accumulation' never gets old.
Solana Price Corrects Gains
Solana price started a decent increase after it cleared the $160 resistance, like Bitcoin and Ethereum. SOL climbed above the $162 level to enter a short-term positive zone.
However, the price is facing a major hurdle at $168 and $169. A high is formed at $168.60 and the price is now correcting gains. There was a MOVE below the 50% Fib retracement level of the upward move from the $158 swing low to the $168 high.
Besides, there was a break below a key bullish trend line with support at $162 on the hourly chart of the SOL/USD pair. solana is now trading below $162 and the 100-hourly simple moving average. It is also trading below the 76.4% Fib retracement level of the upward move from the $158 swing low to the $168 high.
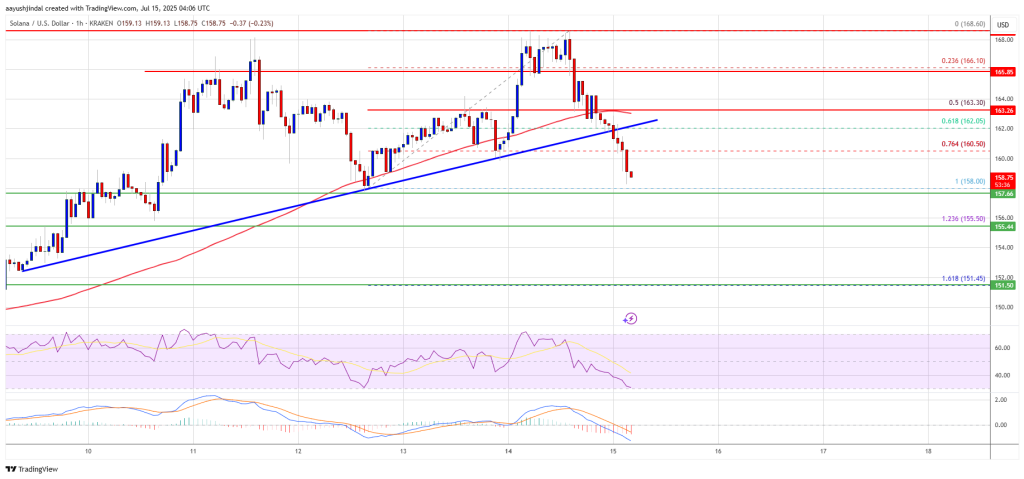
The price is now approaching the $158 support. On the upside, the price is facing resistance NEAR the $160 level. The next major resistance is near the $162 level. The main resistance could be $1685. A successful close above the $168 resistance zone could set the pace for another steady increase. The next key resistance is $178. Any more gains might send the price toward the $185 level.
More Losses in SOL?
If SOL fails to rise above the $162 resistance, it could start another decline. Initial support on the downside is near the $158 zone. The first major support is near the $155 level.
A break below the $155 level might send the price toward the $150 zone. If there is a close below the $150 support, the price could decline toward the $145 support in the near term.
Technical Indicators
Hourly MACD – The MACD for SOL/USD is gaining pace in the bearish zone.
Hourly Hours RSI (Relative Strength Index) – The RSI for SOL/USD is below the 50 level.
Major Support Levels – $158 and $155.
Major Resistance Levels – $162 and $168.
