XRP Pulls Back from Rally — Key Support Levels to Watch Now

XRP's red-hot streak hits a speed bump as traders eye critical floors.
After a parabolic surge, the remittance token takes a breather—standard profit-taking or warning signs ahead?
Key supports to watch: The $0.55 zone becomes make-or-break territory. Lose that, and suddenly the 'institutional adoption' narrative starts smelling like last week's sushi.
Meanwhile, Bitcoin maximalists smugly adjust their tinfoil hats—because nothing says 'healthy market' like schadenfreude dressed as analysis.
XRP Price Rallies Over 5%
XRP price started a fresh increase after it settled above the $2.650 level, like Bitcoin and Ethereum. The price was able to climb above the $2.80 resistance level.
The recent MOVE was positive and the bulls pushed the price above the $3.00 level. A high was formed at $3.0324 and the price is now correcting gains. There was a move below the 50% Fib retracement level of the upward move from the $2.660 swing low to the $3.0324 high.
The price is now trading above $2.80 and the 100-hourly Simple Moving Average. Besides, there is a key bullish trend line forming with support at $2.820 on the hourly chart of the XRP/USD pair.
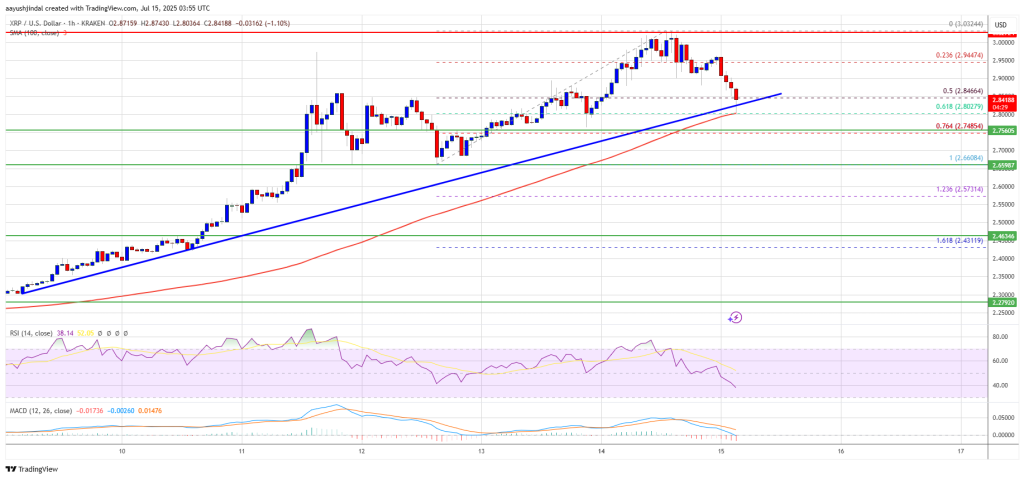
On the upside, the price might face resistance NEAR the $2.920 level. The first major resistance is near the $2.950 level. A clear move above the $2.950 resistance might send the price toward the $3.020 resistance. Any more gains might send the price toward the $3.080 resistance or even $3.120 in the near term. The next major hurdle for the bulls might be near the $3.20 zone.
More Downsides?
If XRP fails to clear the $2.950 resistance zone, it could start another decline. Initial support on the downside is near the $2.820 level and the trend line zone. The next major support is near the $2.80 level and the 76.4% Fib retracement level of the upward move from the $2.660 swing low to the $3.0324 high.
If there is a downside break and a close below the $2.80 level, the price might continue to decline toward the $2.750 support. The next major support sits near the $2.650 zone.
Technical Indicators
Hourly MACD – The MACD for XRP/USD is now losing pace in the bullish zone.
Hourly RSI (Relative Strength Index) – The RSI for XRP/USD is now below the 50 level.
Major Support Levels – $2.820 and $2.750.
Major Resistance Levels – $2.950 and $3.020.

Log in to Reply
Log in to comment your thoughtsComments
Related Articles
|Square
Get the BTCC app to start your crypto journey
Get started today Scan to join our 100M+ users