Bitcoin Smashes $122,000 Barrier—ETF Frenzy Fuels Historic Rally

Wall Street's favorite crypto wrapper is pumping Bitcoin to uncharted territory. ETF inflows are turning the digital gold rush into a full-blown stampede—while traditional finance scrambles to justify its 8% annual returns.
The institutional floodgates are wide open. With $122,000 now in the rearview, the real question isn't about resistance levels—it's about how many zeros the old-money dinosaurs will ignore before FOMO kicks in.
Remember when they called it a bubble at $20K? The suits have stopped laughing and started allocating. Your move, boomer portfolios.
Bitcoin ETFs Explode
Based on reports, Bitcoin ETFs saw $1.20 billion flow in on Thursday alone. That was the biggest single‑day haul of 2025.
Last week, QCP Capital said institutional flows into spot BTC ETFs topped $2 billion. These numbers suggest big players are betting on more upside.
Open interest on futures now exceeds $43 billion. Funding rates on perpetual contracts are climbing too, showing crowded long positions.
US President Donald Trump has voiced his support for clearer crypto rules. And on Monday, the US House of Representatives began debating a package of crypto bills aimed at giving firms more certainty.
Companies have been adding bitcoin to their treasuries, with some corporate holdings rising by double‑digit percentages this year. According to BTSE COO Jeff Mei, longer‑term institutional buyers are driving prices higher.
He forecasted that bitcoin could hit $125K “in the next month or two.” Mei also warned that trade disputes with the EU, Mexico and other partners might cause dips, but said buyers are holding firm.
Rising Demand From Big Players
Trading desks and crypto exchanges say they have seen fresh corporate orders. Some firms are buying blocks of 100 BTC or more at a time.
Others are using dollar‑cost averaging to ease in gradually. Even smaller funds are boosting allocations, pushing aggregate demand higher.
With every new all‑time high, more headlines appear and more investors pay attention. That creates a feedback loop: rising prices attract inflows, which lift prices further.
It the entire price history of Bitcoin was a fruit, what fruit WOULD you say it was? pic.twitter.com/FPEU1bUvnf
— Peter Brandt (@PeterLBrandt) July 13, 2025

Meanwhile, veteran trader Peter Brandt caught attention over the weekend with his “banana” chart. He sketched bitcoin’s entire price history as a curved arc.
The top of that arc sits NEAR current levels, hinting at a ceiling where past rallies ended in sharp drops. Parabolic moves have a habit of reversing quickly.
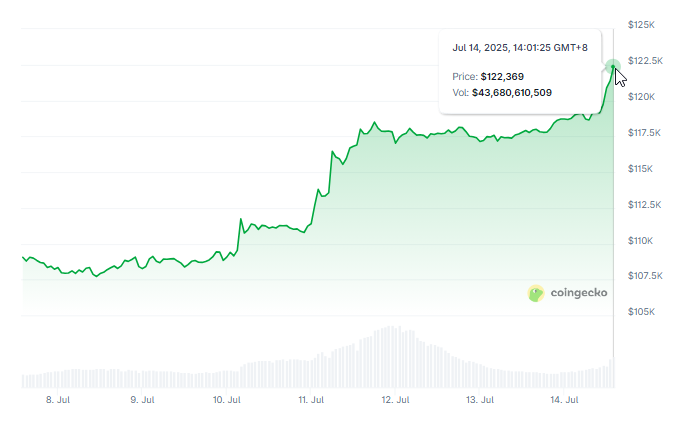
In just seven days, Bitcoin climbed from about $108K to over $122K—roughly a 14% rise. High funding rates and record open interest signal froth, and that often precedes pullbacks.
Watch For Pullbacks And BreakoutsTraders now face two scenarios. If institutional buyers keep adding, new highs may follow and $125K could fall within reach. But if ETF purchases slow or Leveraged longs get squeezed, a 10–20% correction would not be surprising.
Featured image from Vecteezy, chart from TradingView
