Solana’s Rollercoaster: Why a Drop to $95 Could Fuel the Rocket to $200

Solana bulls, brace yourselves—this high-speed blockchain isn’t immune to turbulence. Here’s why a sharp correction could be the launchpad for its next leg up.
The $95 Pit Stop: A Necessary Detour?
Market whispers suggest SOL might retest support levels before its next breakout. A dip to $95 wouldn’t just shake out weak hands—it’d mirror historical patterns where Solana’s deepest corrections preceded its most violent rallies.
Liquidity Hunt: Algos Love a Good Fakeout
High-frequency traders thrive on these setups. A swift plunge to triple digits could trigger stop-loss cascades, giving institutional players the liquidity vacuum they crave before the real move north.
The $200 Endgame: Why Short-Term Pain Equals Long-Term Gain
Every crypto veteran knows the drill: assets don’t go parabolic without first cleaning house. If SOL holds key Fibonacci levels during the drop, the path to $200 becomes exponentially clearer—just in time for the next wave of ‘genius’ VC money chasing momentum.
Remember: in crypto, the market takes the stairs down and the elevator up. Solana’s no exception—even if its cheerleaders pretend otherwise.
Why Solana Could See A Price Crash
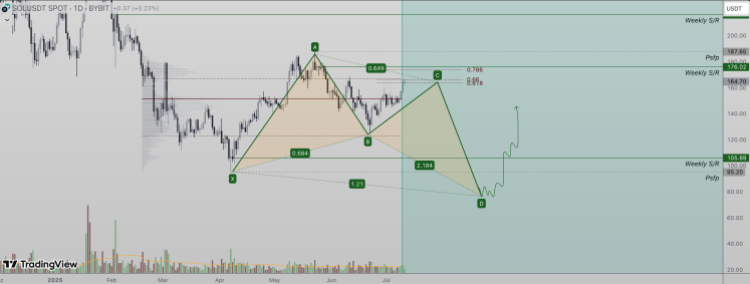
Crypto analyst The Alchemist Trader has highlighted the development of a rare bullish harmonic pattern on the solana price chart. Now, while this pattern formation is inherently bullish for any digital asset, the shorter term does come with some hurdles for the altcoin to surmount first.
The main thing to focus on here is that this bullish pattern does initially trigger a liquidity sweep of previous lows. In this case, the recent Solana price low lies at the $95 level, which is a 40% decrease from its current price, trending above $150. The possibility of this low sweep is made even more prominent by a couple of technical developments on the chart.
The first technical point the analyst shows is the Point of Control (POC) Battle. According to the analysis, the solana price is now testing this POC level with low momentum, shown by the slow climb over the last few days. Additionally, there is also mounting resistance at the Value Area High and the 0.618 Fibonacci level, which lies just above $163. Then, there is the completion of the C-leg of the wave, putting it as low as $95.
A crash to this level becomes more likely if the Solana price fails to break through the resistance with conviction. If the price is rejected and the C-leg does play out, then this correction is expected to trigger the 40% crash to the $95 level.
It’s Not All Bearish News
As already mentioned above, the bearish leg of the rare bullish harmonic pattern is only temporary and often gives way to an even stronger impulse move. As the crypto analyst explains, the crash to $95 will only happen in the immediate short term, but it does not actually invalidate the overall bullish trend.
Once the D-leg is over and the crash is completed, the crypto analyst predicts that the Solana price will start to rally again. From the predicted $05 lows, an over 100% MOVE is expected to take it back to $200 and beyond before the rally is over.
The analyst explains that “Until this scenario is confirmed or invalidated, Solana remains range-bound between major high time frame levels.” Therefore, “Traders should stay alert for signs of rejection at current resistance — or, conversely, a volume-backed breakout above the value area high that WOULD negate the harmonic setup.”

Log in to Reply
Log in to comment your thoughtsComments
Related Articles
|Square
Get the BTCC app to start your crypto journey
Get started today Scan to join our 100M+ users