Bitcoin Teeters on the Brink: One Candlestick Away From $141,300 Mega-Breakout, Says Top Chart Analyst

Bitcoin's price action is coiled like a spring—and one more green candle could trigger a historic surge past $141,300. Here's why traders are glued to their screens.
The Setup: A Powder Keg Pattern
Weekly charts show BTC has formed a textbook bullish consolidation pattern. Now it's testing resistance levels that haven't been touched since the 2021 mania—back when Elon Musk was still pretending to care about DOGE.
Why $141,300 Matters
That number isn't arbitrary. It's the last major technical hurdle before Bitcoin enters price discovery mode. Break it, and suddenly those "$500K BTC by 2026" predictions don't sound quite so insane.
Traders Are Loading Up
Options markets show heavy call buying at the $150K strike. Meanwhile, Bitcoin whales have been quietly accumulating—because nothing says 'smart money' like front-running your own hype.
The Flip Side: Watch For Fakeouts
Not everyone's convinced. Some analysts warn this could be a classic bull trap—the kind that leaves retail traders holding bags while institutions cash out. But hey, since when has caution ever stopped a crypto rally?
One thing's certain: whether this breakout succeeds or fails, the volatility will be spectacular. Just maybe keep some fiat handy for the inevitable 'correction'—Wall Street loves a good fire sale.
Bitcoin Poised For $141,300
Kibar’s chart first revisits the basing sequence that reversed the 2022 bear cycle. A textbook inverse head-and-shoulders bottom completed in early-2023, with troughs at roughly $17,600 (left shoulder), $15,500 (head) and $19,500 (right shoulder). The breakout above the neckline sent Bitcoin to $31,400.
Immediately thereafter, price stalled in a six-month rectangle bounded by $25,000 support and $31,400 resistance. The eventual topside resolution propelled the market to the rectangle’s implied target of $38,000, validating two consecutive classical projections in less than a year. Afterwards, the BTC price grinded higher. Below $73,700, BTC consolidated in a falling wedge, ending with a breakout toward $109,000.
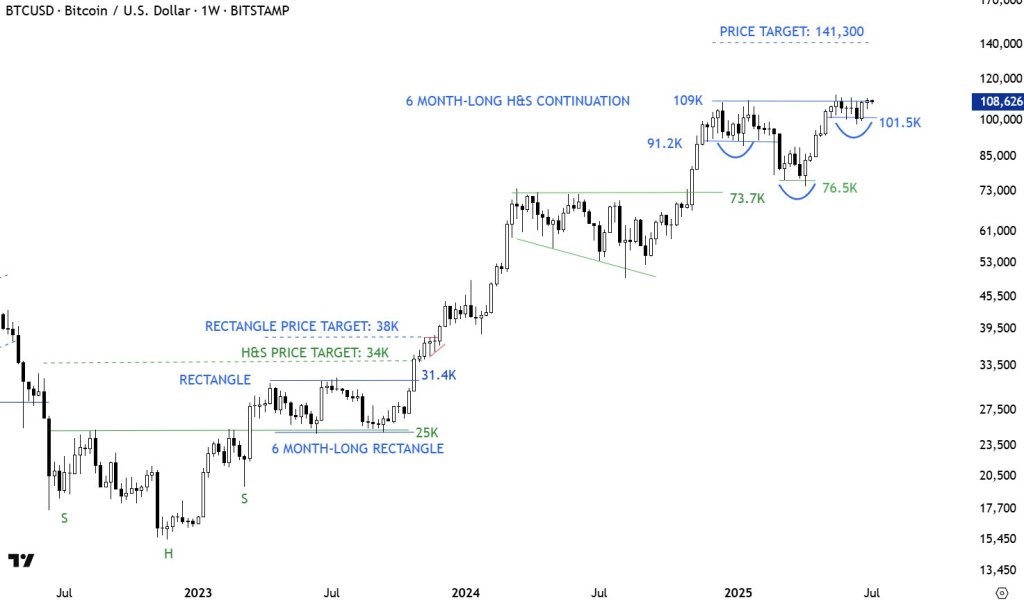
From that point, the initial pullback bottomed at $91,200, creating what Kibar designates as the left shoulder. A deeper descent to $76,500 carved out the head. Then, the Bitcoin price formed the right shoulder at $101,500, echoed by the blue bowl-shaped arc on the chart.
Throughout this structure the neckline at $109,000 remained intact, acting as a clear demarcation between consolidation and fresh highs. The inverse head-and-shoulders pattern spans roughly half a year, matching the analyst’s “6-month-long” annotation.
Using the orthodox H&S continuation rule—adding the vertical distance from the head ($73,700) to the neckline ($109,000) to the breakout level—Kibar derives a price objective of $141,300. He notes in an X reply that this target is separate from the earlier $137,000 objective, which came from a larger cup-with-handle on the monthly scale. In other words, the shorter-term weekly pattern now projects modestly higher than the longer-term structure.
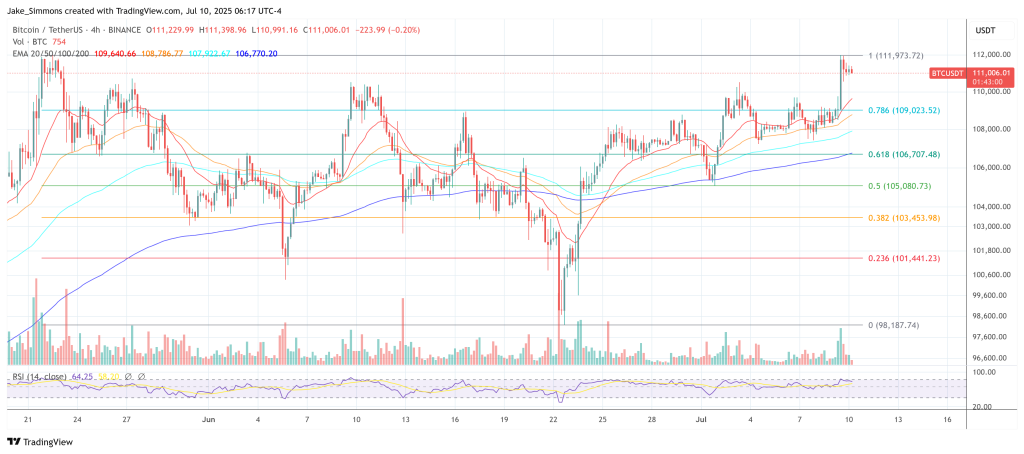
At press time Bitcoin, bitcoin traded near $111,000, surpassing the neckline. However, from a technician’s standpoint, the breakout still needs to confirm with the weekly close. Confirmation requires a decisive weekly settlement north of the $109,000 neckline. As Kibar notes: “Breakout needs to take place with a long white candle, similar to previous pattern completions. There should be no hesitation.”
Invalidation WOULD emerge on a weekly close back below the most recent swing-low support at $101,500; deeper failure beneath $91,2000 would unravel the pattern entirely.
For now, Bitcoin sits at the fulcrum of its six-month equilibrium. A weekly candle or two should reveal whether the largest digital asset can convert yet another classical chart formation into a measured move—this time toward mid-six-figure territory.