Solana (SOL) Surges to $160 — Can Bulls Smash Through This Resistance?

Solana rockets past key psychological level as traders eye breakout potential.
Bulls charge as SOL tests critical resistance—will the momentum hold or fade?
Technical traders are glued to charts while skeptics mutter about 'another crypto pump waiting for a dump.'
One thing's clear: The market's appetite for risk is back—for now.
Solana Price Aims Higher
Solana price started a decent increase after it cleared the $152 resistance, like Bitcoin and Ethereum. SOL climbed above the $155 level to enter a short-term positive zone.
However, the price is facing a major hurdle at $160 and $162. A high is formed at $159.24 and the price is now consolidating gains above the 23.6% Fib retracement level of the upward MOVE from the $148 swing low to the $160 high.
Solana is now trading above $155 and the 100-hourly simple moving average. There is also a key bullish trend line forming with support at $155 on the hourly chart of the SOL/USD pair.
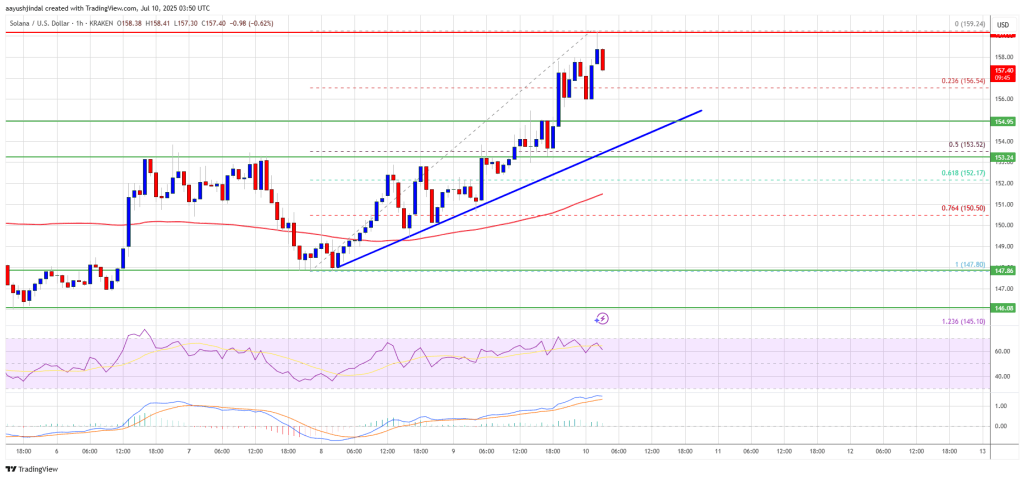
On the upside, the price is facing resistance NEAR the $160 level. The next major resistance is near the $162 level. The main resistance could be $165. A successful close above the $165 resistance zone could set the pace for another steady increase. The next key resistance is $178. Any more gains might send the price toward the $185 level.
Another Decline in SOL?
If SOL fails to rise above the $160 resistance, it could start another decline. Initial support on the downside is near the $155 zone and the trend line. The first major support is near the $152 level or the 61.8% Fib retracement level of the upward move from the $148 swing low to the $160 high.
A break below the $152 level might send the price toward the $145 zone. If there is a close below the $145 support, the price could decline toward the $136 support in the near term.
Technical Indicators
Hourly MACD – The MACD for SOL/USD is gaining pace in the bullish zone.
Hourly Hours RSI (Relative Strength Index) – The RSI for SOL/USD is above the 50 level.
Major Support Levels – $155 and $152.
Major Resistance Levels – $160 and $162.
