Bitcoin Battles Resistance: Bulls Face Third Rejection at $110K Threshold

Bitcoin's rally hits a wall—again. The $110K psychological barrier proves tougher than a Wall Street banker's poker face as BTC gets rejected for the third time this month.
No breakout, no glory. Traders are left chewing their nails while 'HODL' memes flood Crypto Twitter. Meanwhile, institutional investors quietly accumulate—because nothing says 'trust the process' like buying the dip with other people's money.
Key levels to watch: A clean break above $110K could trigger FOMO buying, while failure here may see a retest of $95K support. Either way, volatility's back on the menu.
Bitcoin Price Dips Again
Bitcoin price started a fresh increase after it settled above the $108,500 resistance. BTC cleared many hurdles NEAR $109,000 to start a decent increase but it failed to clear $110,000.
A high was formed at $109,700 and the price started a fresh decline. There was a MOVE below the $109,200 and $108,500 levels. Besides, there was a break below a key bullish trend line with support at $108,200 on the hourly chart of the BTC/USD pair.
Bitcoin is now trading below $108,500 and the 100 hourly Simple moving average. On the upside, immediate resistance is near the $108,150 level. It is close to the 23.6% Fib retracement level of the downward move from the $109,700 swing high to the $107,674 low.
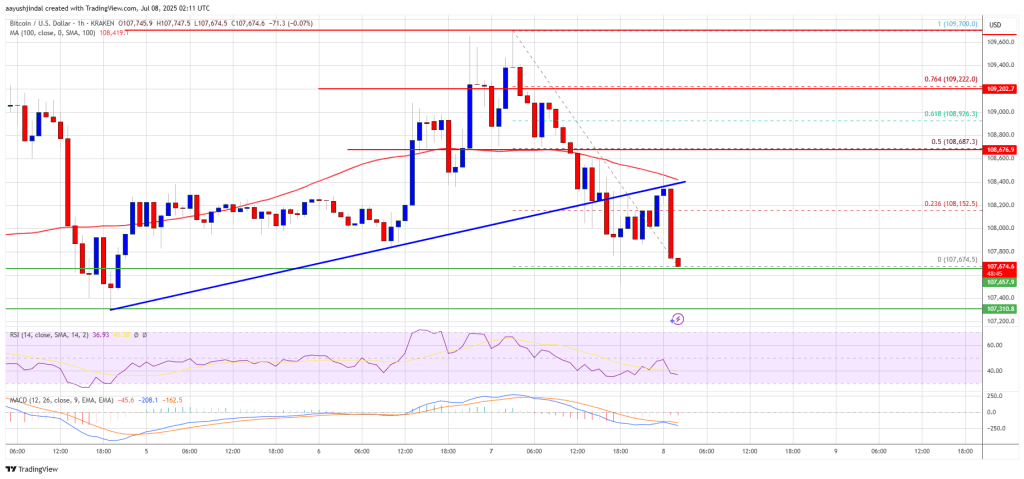
The first key resistance is near the $108,500 level or the 50% Fib retracement level of the downward move from the $109,700 swing high to the $107,674 low. A close above the $108,500 resistance might send the price further higher. In the stated case, the price could rise and test the $110,000 resistance level. Any more gains might send the price toward the $112,000 level. The main target could be $115,000.
More Losses In BTC?
If Bitcoin fails to rise above the $108,500 resistance zone, it could start another decline. Immediate support is near the $107,500 level. The first major support is near the $106,500 level.
The next support is now near the $105,500 zone. Any more losses might send the price toward the $104,200 support in the near term. The main support sits at $103,500, below which BTC might continue to move down.
Technical indicators:
Hourly MACD – The MACD is now gaining pace in the bearish zone.
Hourly RSI (Relative Strength Index) – The RSI for BTC/USD is now below the 50 level.
Major Support Levels – $107,500, followed by $106,500.
Major Resistance Levels – $108,500 and $106,500.
