Bitcoin Bull Run Countdown: Analyst Drops the Ultimate Cheat Sheet for Timing the Next Mega Rally

Forget crystal balls—this Bitcoin cheat sheet cuts through the noise to pinpoint when the bulls charge back.
Decoding the cycles
History doesn’t repeat, but it sure rhymes. The analyst’s model flags key indicators that screamed ‘buy’ before past parabolic runs—and they’re lining up again.
Wall Street’s worst nightmare
While traditional finance scrambles to ‘hedge inflation’ with 2% yield products, Bitcoin’s gearing up to bypass the slow bleed. The sheet highlights exact thresholds where BTC historically shifts from accumulation to vertical takeoff.
Timing the liftoff
No vague moon predictions here. The cheat sheet isolates specific on-chain and technical triggers—from miner capitulation thresholds to exchange outflow spikes—that’ve preceded every major bull run since 2016.
Wake-up call for the suits: Your ‘diversified portfolio’ is a euphemism for guaranteed mediocrity when Bitcoin enters this phase.
Bitcoin Cheat Sheet Declares Start Of Final Bull Phase
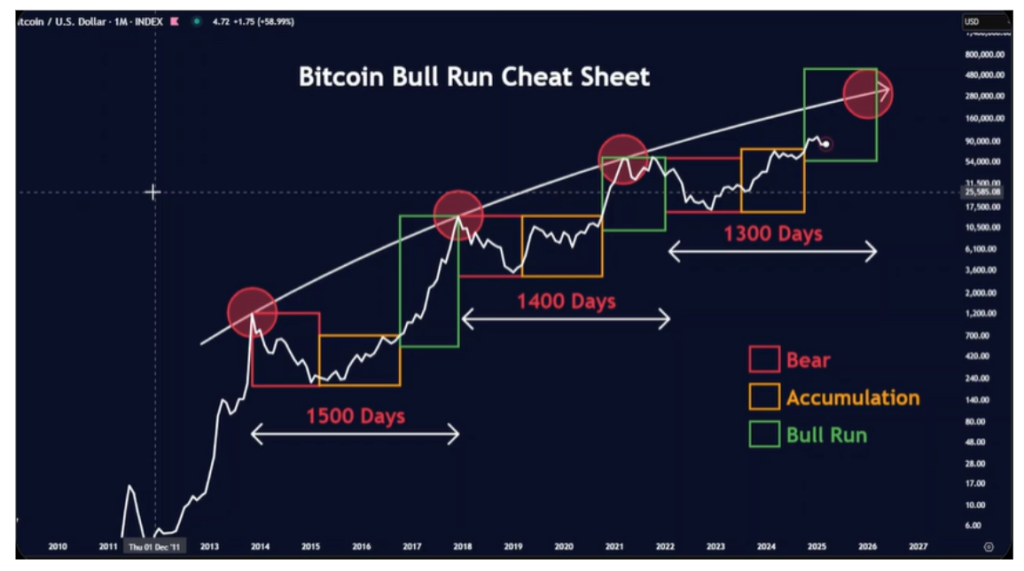
In a recent post on X, Merlijn The Trader released what he dubbed the “Bitcoin Bull Run Cheat Sheet.” This cheat sheet is a breakdown of Bitcoin’s past market movements that shows the distinct phases of bear markets, accumulation zones, and subsequent parabolic bull runs.
The cheat sheet divides each of Bitcoin’s two previous cycles from 2014 into three colored boxes: red for bear markets, orange for accumulation, and green for bull runs. Merlijn’s chart traces this repeating structure over the past decade, showing how each bull market followed a similar rhythm that began after a lengthy consolidation period and ended with a strong price explosion.
The first full cycle began with Bitcoin’s peak around $1,000 in December 2013. Following that top, the price entered a long, painful bear market that spanned into 2015. This red-box phase eventually transitioned into accumulation, where bitcoin traded sideways between $80 and $500 for a prolonged period. The green bull run box on the chart began around early 2017, and eventually ended with a peak just below $20,000 in late 2017. According to the cheat sheet, this entire cycle from peak to new peak lasted 1500 days.
Bitcoin’s second cycle kicked off after its December 2017 top. A long drawdown followed, and the bear market phase dragged Bitcoin down to $3,000 by the end of 2018. The chart marks this point with another red box, followed by the orange accumulation zone that stretched well into 2020.
The cheat sheet’s green box reappeared in late 2020 right as Bitcoin broke above its previous highs. The price shot up throughout 2021 and eventually reached a new all-time high around $69,000 in November of that year. This second full cycle was shorter than the first and spanned around 1400 days from the previous top.
When Will The Next Bull Run Begin?
The current cycle began with Bitcoin’s all-time high in November 2021. Since then, the market has gone through its familiar sequence. A sharp decline into 2022 which bottomed around $15,000 represents the bear market phase. The decline was followed by nearly a year of sideways movement and slow recovery up until early 2025. This is represented as the orange accumulation box on the cheat sheet above.
According to the analyst, Bitcoin is now in the next bull phase, and possibly the largest one yet. The chart projects a continuation along the long-term growth curve, possibly toward the $250,000 to $300,000 range over the coming year. Notably, the timeline for the entire cycle this time should take about 1,300 days from late 2021 to complete.
At the time of writing, Bitcoin is trading at $108,260.
Featured image from Pixabay, chart from TradingView
