Ethereum’s Rising Wedge Tightens – Will $2,200 Support Hold or Fold?

Ethereum traders are sweating over a textbook rising wedge pattern—the kind that makes technical analysts reach for their whiskey bottles. With $2,200 support back in the crosshairs, bulls and bears are locked in a tug-of-war.
The Wedge: Beauty or Beast?
This isn't your grandma's consolidation pattern. Rising wedges scream 'volatility trap'—especially when ETH's flirting with key psychological levels. Break north? Party time. Crumble south? Cue the 'I told you so' tweets from crypto permabears.
$2,200: The Line in the Sand
That support level isn't just a number—it's the difference between 'healthy correction' and 'oh crap' for leveraged positions. Market makers know it. Whale wallets know it. And now your Uber driver 'investing guru' knows it too.
Watch for volume spikes. Noisy breakdowns without liquidity screams are just Wall Street ghosts shaking out weak hands—another Tuesday in crypto. But sustained closes below $2,200? That's when the 'long-term hold' crowd suddenly remembers they have stop-loss orders.
Meanwhile in TradFi Land...
Bankers are still trying to short ETH with one hand while filing Bitcoin ETF applications with the other. Some things never change—like institutional FOMO dressed up as 'risk management.'
Bottom line: Ethereum's playing chicken with gravity. Whether this ends in a breakout or breakdown, one thing's guaranteed—the crypto Twitter meltdown will be spectacular.
Ethereum Faces A Critical Level
Ethereum is approaching a crucial juncture following a week marked by volatility and renewed bullish momentum. After reclaiming the $2,500 level and rising over 23% since June 22, ETH has regained the attention of investors. However, the rally now faces a critical test: breaking above the $2,700 resistance level. A successful MOVE above this threshold could ignite a broader altcoin rally, as Ethereum often acts as the leader for the altcoin market.
Market sentiment remains cautiously optimistic, with bulls appearing to control short-term price action. Ethereum is trading above key moving averages and remains structurally bullish on higher timeframes. Yet, price has stalled just below the $2,600–$2,700 zone—a key supply area that must be flipped into support to confirm the next upward leg. A clean breakout could propel ETH into a new price range, allowing other altcoins to follow and break above their own resistance levels.
Carl Runefelt cautions that Ethereum is currently forming a rising wedge pattern on the 4-hour chart—a potentially bearish setup. If the pattern plays out, ETH could fail to break higher and instead fall back toward lower support zones. Runefelt points to the $2,200 level as a key horizontal support that could be tested if momentum weakens and sellers regain short-term control.
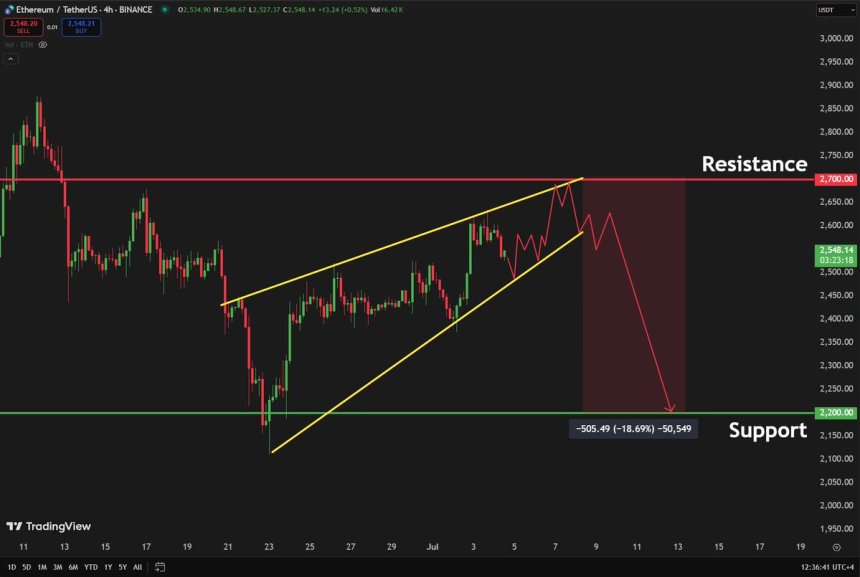
For now, Ethereum’s price action remains in a tight range. A decisive breakout or breakdown will likely define the direction of the altcoin market in the weeks ahead. Traders and investors alike are closely watching ETH’s next move, as it could set the tone for the remainder of the summer crypto cycle.
ETH Price Analysis: Key Resistance At $2,600
Ethereum’s price action continues to reflect a tug-of-war between bulls and bears as it hovers around the $2,550 level, just under the critical resistance at $2,600. After reclaiming that level briefly, ETH failed to hold its gains and pulled back slightly, suggesting sellers remain active at this zone. The chart shows Ethereum forming a lower high in the NEAR term, raising short-term caution among traders.
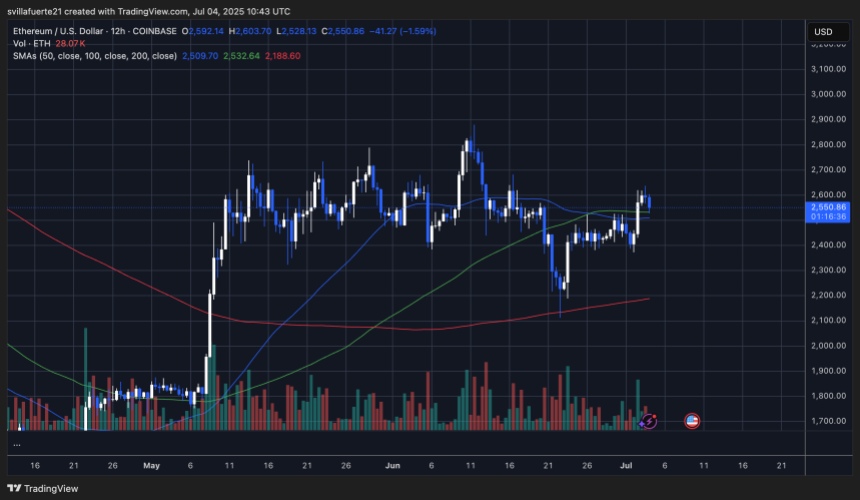
The 50-day and 100-day simple moving averages are now converging around $2,500–$2,530, acting as immediate support. As long as ETH holds above these levels, the medium-term outlook remains constructive. However, any sustained drop below these moving averages could invite additional downside pressure, possibly dragging the price back toward the $2,400 range or even testing the 200-day SMA near $2,180.
Volume has remained moderate, showing that neither side has taken full control. Until ETH decisively breaks above $2,600 and flips it into support, the uptrend remains unconfirmed. The next key resistance sits at $2,700. Conversely, a rejection from current levels could indicate the formation of a range-bound structure or a rising wedge breakdown, as some analysts like Carl Runefelt suggest.
Featured image from Dall-E, chart from TradingView
