Bitcoin’s Spring Tightens—Will It Explode Past $110K in 2025?

Bitcoin's price action is coiling like a snake ready to strike—and traders are betting the next move could shatter the $110K barrier.
The Compression Play
Volatility has flatlined to 2021-levels, but don't let the calm fool you. Every major squeeze this tight in BTC history preceded a 200%+ eruption. The last time Bollinger Bands hugged this close? December 2020—right before the run to $69K.
Wall Street's FOMO Gauge Is Redlining
Spot ETF inflows just hit $1.2B weekly despite SEC chair Gensler's 'investor protection' sermons. Meanwhile, BlackRock's IBIT now holds more BTC than MicroStrategy—because nothing screams 'decentralization' like institutional custody.
The $110K Calculus
A clean break above the current $72K resistance would open the path to six figures. Derivatives traders are already pricing in 25% odds of a September surge—higher than the chance of Congress passing a crypto tax bill that makes sense.
Watch the weekly close. If BTC holds above $70K with conviction, even the permabears might start buying... right before the inevitable 'healthy correction' they predicted at $30K.
Bitcoin Price Consolidates Gains
Bitcoin price started a fresh increase after it settled above the $105,500 resistance. BTC cleared many hurdles NEAR $107,000 to start a decent increase.
The bulls pushed the price in a positive zone above the $108,000 level. The price even spiked above the $110,000 level before the bears appeared. A high was formed near $110,578 and the price is now consolidating gains near the 23.6% Fib retracement level of the upward MOVE from the $105,116 swing low to the $110,578 high.
Bitcoin is now trading above $108,000 and the 100 hourly Simple moving average. Besides, there is a short-term rising channel forming with support at $109,500 on the hourly chart of the BTC/USD pair.
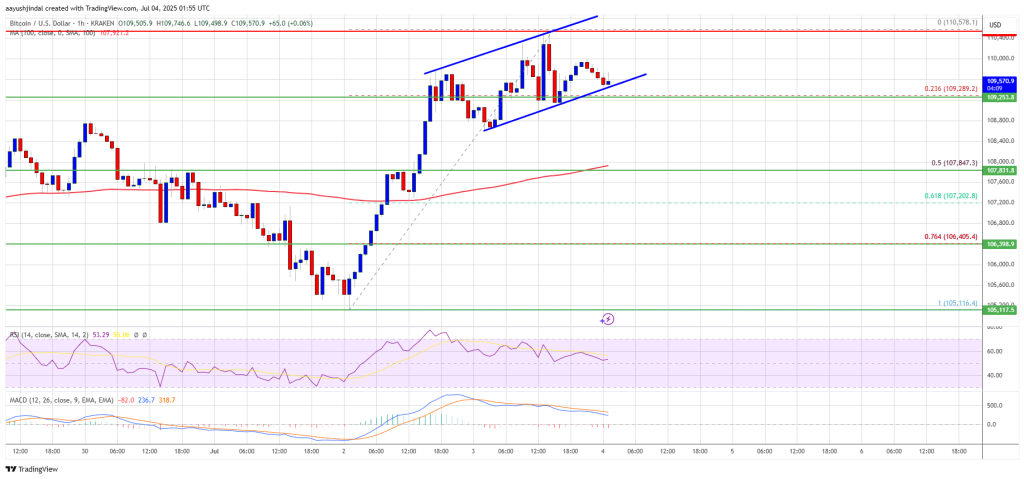
On the upside, immediate resistance is near the $110,000 level. The first key resistance is near the $110,500 level. A close above the $110,500 resistance might send the price further higher. In the stated case, the price could rise and test the $112,000 resistance level. Any more gains might send the price toward the $113,200 level.
Downside Correction In BTC?
If Bitcoin fails to rise above the $110,000 resistance zone, it could start another decline. Immediate support is near the $109,500 level and the channel’s trend line. The first major support is near the $108,800 level.
The next support is now near the $107,850 zone and the 50% Fib retracement level of the upward move from the $105,116 swing low to the $110,578 high. Any more losses might send the price toward the $106,400 support in the near term. The main support sits at $105,000, below which BTC might continue to move down.
Technical indicators:
Hourly MACD – The MACD is now losing pace in the bullish zone.
Hourly RSI (Relative Strength Index) – The RSI for BTC/USD is now above the 50 level.
Major Support Levels – $108,800, followed by $107,850.
Major Resistance Levels – $110,000 and $110,500.
